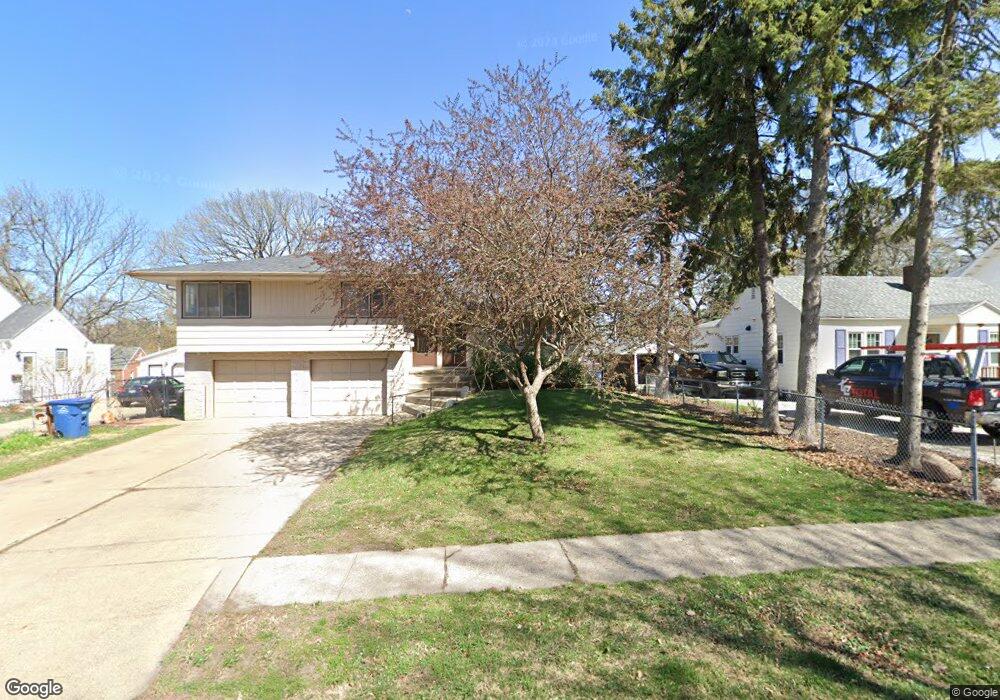
2523 35th St Des Moines, IA 50310
Beaverdale NeighborhoodEstimated Value: $265,000 - $315,000
4
Beds
2
Baths
1,968
Sq Ft
$148/Sq Ft
Est. Value
About This Home
This home is located at 2523 35th St, Des Moines, IA 50310 and is currently estimated at $290,342, approximately $147 per square foot. 2523 35th St is a home located in Polk County with nearby schools including Monroe Elementary School, Meredith Middle School, and Hoover High School.
Ownership History
Date
Name
Owned For
Owner Type
Purchase Details
Closed on
Oct 14, 2015
Sold by
Crouch Mark J and Crouch Seth W
Bought by
Swcmjc Llc
Current Estimated Value
Purchase Details
Closed on
Jul 16, 2014
Sold by
Swanson Andrew A and Swanson Mary E
Bought by
Swanson Andrew A
Purchase Details
Closed on
Jan 29, 2014
Sold by
Swanson Andrew A and Swanson Mary E
Bought by
Crouch Mark J and Crouch Seth W
Purchase Details
Closed on
Nov 4, 2005
Sold by
Siems Kent L and Siems Angela M
Bought by
Swanson Andrew A and Swanson Mary E
Home Financials for this Owner
Home Financials are based on the most recent Mortgage that was taken out on this home.
Original Mortgage
$126,400
Interest Rate
5.98%
Mortgage Type
Fannie Mae Freddie Mac
Create a Home Valuation Report for This Property
The Home Valuation Report is an in-depth analysis detailing your home's value as well as a comparison with similar homes in the area
Home Values in the Area
Average Home Value in this Area
Purchase History
| Date | Buyer | Sale Price | Title Company |
|---|---|---|---|
| Swcmjc Llc | -- | None Available | |
| Swanson Andrew A | -- | None Available | |
| Crouch Mark J | $160,300 | None Available | |
| Swanson Andrew A | $157,500 | -- |
Source: Public Records
Mortgage History
| Date | Status | Borrower | Loan Amount |
|---|---|---|---|
| Previous Owner | Swanson Andrew A | $126,400 | |
| Closed | Crouch Mark J | $0 |
Source: Public Records
Tax History Compared to Growth
Tax History
| Year | Tax Paid | Tax Assessment Tax Assessment Total Assessment is a certain percentage of the fair market value that is determined by local assessors to be the total taxable value of land and additions on the property. | Land | Improvement |
|---|---|---|---|---|
| 2025 | $5,286 | $292,600 | $59,200 | $233,400 |
| 2024 | $5,286 | $268,700 | $53,300 | $215,400 |
| 2023 | $5,296 | $268,700 | $53,300 | $215,400 |
| 2022 | $5,256 | $224,700 | $47,100 | $177,600 |
| 2021 | $5,156 | $224,700 | $47,100 | $177,600 |
| 2020 | $5,356 | $206,600 | $43,100 | $163,500 |
| 2019 | $5,076 | $206,600 | $43,100 | $163,500 |
| 2018 | $5,026 | $188,900 | $38,300 | $150,600 |
| 2017 | $4,544 | $188,900 | $38,300 | $150,600 |
| 2016 | $4,428 | $168,000 | $33,600 | $134,400 |
| 2015 | $4,428 | $168,000 | $33,600 | $134,400 |
| 2014 | $4,260 | $160,300 | $31,800 | $128,500 |
Source: Public Records
Map
Nearby Homes