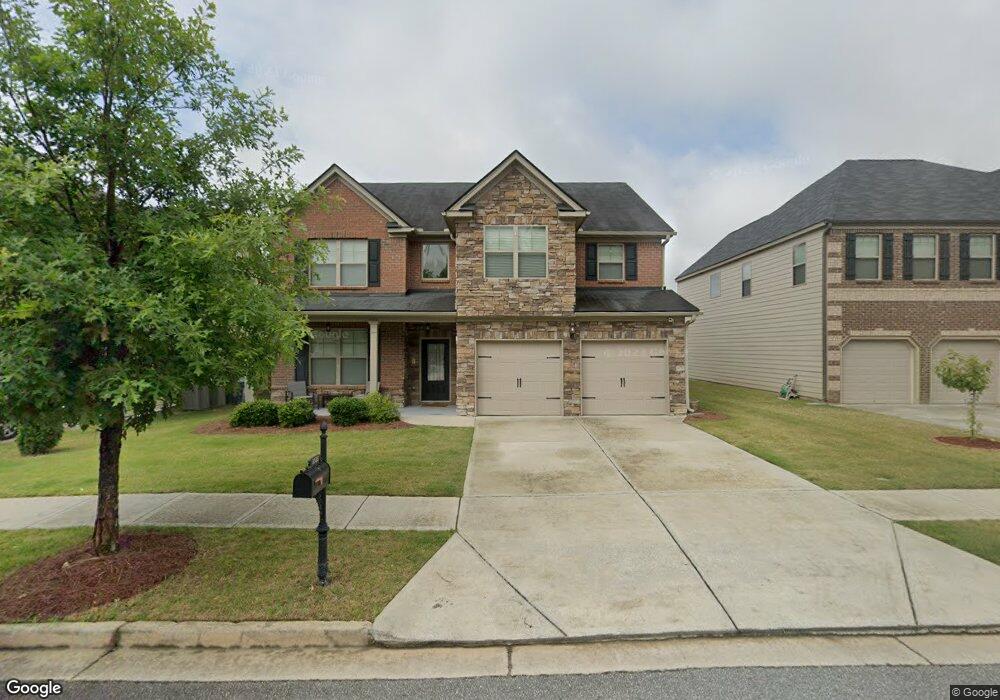
2523 Zablan Ave Unit 158 Bethlehem, GA 30620
Estimated Value: $397,000 - $425,000
5
Beds
3
Baths
2,874
Sq Ft
$142/Sq Ft
Est. Value
About This Home
This home is located at 2523 Zablan Ave Unit 158, Bethlehem, GA 30620 and is currently estimated at $408,623, approximately $142 per square foot. 2523 Zablan Ave Unit 158 is a home located in Gwinnett County with nearby schools including Harbins Elementary School, McConnell Middle School, and Archer High School.
Ownership History
Date
Name
Owned For
Owner Type
Purchase Details
Closed on
May 31, 2019
Sold by
Islas Richard A
Bought by
Larios Kelsey
Current Estimated Value
Home Financials for this Owner
Home Financials are based on the most recent Mortgage that was taken out on this home.
Original Mortgage
$242,250
Outstanding Balance
$212,110
Interest Rate
4.1%
Mortgage Type
New Conventional
Estimated Equity
$196,513
Purchase Details
Closed on
Sep 13, 2017
Sold by
Jones Carrie L
Bought by
Islas Richard A
Home Financials for this Owner
Home Financials are based on the most recent Mortgage that was taken out on this home.
Original Mortgage
$231,233
Interest Rate
4.12%
Mortgage Type
FHA
Purchase Details
Closed on
Dec 18, 2015
Sold by
Reo Funding Solutions Ii Llc
Bought by
Paran Homes Llc
Home Financials for this Owner
Home Financials are based on the most recent Mortgage that was taken out on this home.
Original Mortgage
$216,015
Interest Rate
4.37%
Mortgage Type
FHA
Create a Home Valuation Report for This Property
The Home Valuation Report is an in-depth analysis detailing your home's value as well as a comparison with similar homes in the area
Home Values in the Area
Average Home Value in this Area
Purchase History
| Date | Buyer | Sale Price | Title Company |
|---|---|---|---|
| Larios Kelsey | $255,000 | -- | |
| Islas Richard A | $235,500 | -- | |
| Paran Homes Llc | $34,661 | -- | |
| Jones Carrie L | $220,000 | -- |
Source: Public Records
Mortgage History
| Date | Status | Borrower | Loan Amount |
|---|---|---|---|
| Open | Larios Kelsey | $242,250 | |
| Previous Owner | Islas Richard A | $231,233 | |
| Previous Owner | Jones Carrie L | $216,015 |
Source: Public Records
Tax History Compared to Growth
Tax History
| Year | Tax Paid | Tax Assessment Tax Assessment Total Assessment is a certain percentage of the fair market value that is determined by local assessors to be the total taxable value of land and additions on the property. | Land | Improvement |
|---|---|---|---|---|
| 2025 | $6,879 | $186,000 | $30,000 | $156,000 |
| 2024 | $6,150 | $163,280 | $30,000 | $133,280 |
| 2023 | $6,150 | $167,640 | $34,000 | $133,640 |
| 2022 | $5,580 | $148,120 | $30,000 | $118,120 |
| 2021 | $4,350 | $111,840 | $22,400 | $89,440 |
| 2020 | $4,018 | $102,000 | $19,600 | $82,400 |
| 2019 | $3,870 | $102,000 | $19,600 | $82,400 |
| 2018 | $3,570 | $93,320 | $17,200 | $76,120 |
| 2016 | $3,194 | $88,000 | $17,200 | $70,800 |
| 2015 | $668 | $11,520 | $11,520 | $0 |
| 2014 | $100 | $1,960 | $1,960 | $0 |
Source: Public Records
Map
Nearby Homes
- 3617 Shoal Trail Dr SE
- 3601 Indian Shoals Rd SE
- 3442 Flat Run Dr SE
- 3442 Flat Run Dr Unit 1
- 2060 Marlborough Dr
- 3893 Indian Shoals Rd SE
- 3550 Topeka Springs Trail
- 3001 Saratoga Sky Way
- 3512 Flat Run Dr Unit 2
- 3424 Pratt Way
- 2521 Culpepper Trace Unit 2
- 2614 Carolina Ct Unit 1
- 3344 Pratt Way
- 3287 Hall Rd
- 2422 Snowshoe Bend
- 2523 Zablan Ave
- 2513 Zablan Ave Unit 159
- 2513 Zablan Ave
- 2533 Zablan Ave
- 2532 Martini Way Unit 152
- 2532 Martini Way
- 2542 Martini Way Unit 153
- 2542 Martini Way
- 2503 Zablan Ave
- 2524 Zablan Ave
- 0 Zablan Ave Unit 8416682
- 0 Zablan Ave Unit 8402875
- 0 Zablan Ave Unit 8351148
- 0 Zablan Ave Unit 9021130
- 0 Zablan Ave Unit 8897596
- 0 Zablan Ave Unit 7399804
- 0 Zablan Ave Unit 8208690
- 2543 Zablan Ave
- 2522 Martini Way Unit 151
- 2522 Martini Way