25231 Bay Cedar Dr Bonita Springs, FL 34134
Pelican Landing NeighborhoodEstimated Value: $846,000 - $1,281,000
3
Beds
2
Baths
2,910
Sq Ft
$330/Sq Ft
Est. Value
About This Home
This home is located at 25231 Bay Cedar Dr, Bonita Springs, FL 34134 and is currently estimated at $959,698, approximately $329 per square foot. 25231 Bay Cedar Dr is a home located in Lee County with nearby schools including Spring Creek Elementary School, Pinewoods Elementary School, and Bonita Springs Elementary School.
Ownership History
Date
Name
Owned For
Owner Type
Purchase Details
Closed on
Dec 19, 2019
Sold by
Tarquini Joseph T
Bought by
Dartsch Douglas and Dartsch Debra
Current Estimated Value
Home Financials for this Owner
Home Financials are based on the most recent Mortgage that was taken out on this home.
Original Mortgage
$483,000
Outstanding Balance
$425,834
Interest Rate
3.6%
Mortgage Type
New Conventional
Estimated Equity
$533,864
Purchase Details
Closed on
Dec 30, 1996
Sold by
Crawford David C and Crawford Ann M
Bought by
Tarquini Joseph T and Tarquini Carmella
Purchase Details
Closed on
Mar 17, 1995
Sold by
U S Home Corp
Bought by
Crawford David C and Marlowe Stephen D
Home Financials for this Owner
Home Financials are based on the most recent Mortgage that was taken out on this home.
Original Mortgage
$200,950
Interest Rate
8.81%
Create a Home Valuation Report for This Property
The Home Valuation Report is an in-depth analysis detailing your home's value as well as a comparison with similar homes in the area
Home Values in the Area
Average Home Value in this Area
Purchase History
| Date | Buyer | Sale Price | Title Company |
|---|---|---|---|
| Dartsch Douglas | $690,000 | Florida Ttl & Guarantee Agcy | |
| Tarquini Joseph T | $312,500 | -- | |
| Crawford David C | -- | -- |
Source: Public Records
Mortgage History
| Date | Status | Borrower | Loan Amount |
|---|---|---|---|
| Open | Dartsch Douglas | $483,000 | |
| Previous Owner | Crawford David C | $200,950 |
Source: Public Records
Tax History Compared to Growth
Tax History
| Year | Tax Paid | Tax Assessment Tax Assessment Total Assessment is a certain percentage of the fair market value that is determined by local assessors to be the total taxable value of land and additions on the property. | Land | Improvement |
|---|---|---|---|---|
| 2025 | $10,487 | $693,390 | $416,751 | $218,370 |
| 2024 | $15,331 | $773,535 | $519,813 | $197,510 |
| 2023 | $15,331 | $1,144,187 | $526,101 | $525,712 |
| 2022 | $13,660 | $908,253 | $0 | $0 |
| 2021 | $11,841 | $792,624 | $187,891 | $604,733 |
| 2020 | $11,370 | $735,638 | $144,800 | $590,838 |
| 2019 | $5,888 | $380,550 | $0 | $0 |
| 2018 | $5,865 | $373,454 | $0 | $0 |
| 2017 | $5,792 | $365,773 | $0 | $0 |
| 2016 | $5,772 | $730,519 | $251,651 | $478,868 |
| 2015 | $5,861 | $738,694 | $250,996 | $487,698 |
| 2014 | $5,861 | $721,310 | $261,000 | $460,310 |
| 2013 | -- | $478,075 | $213,595 | $264,480 |
Source: Public Records
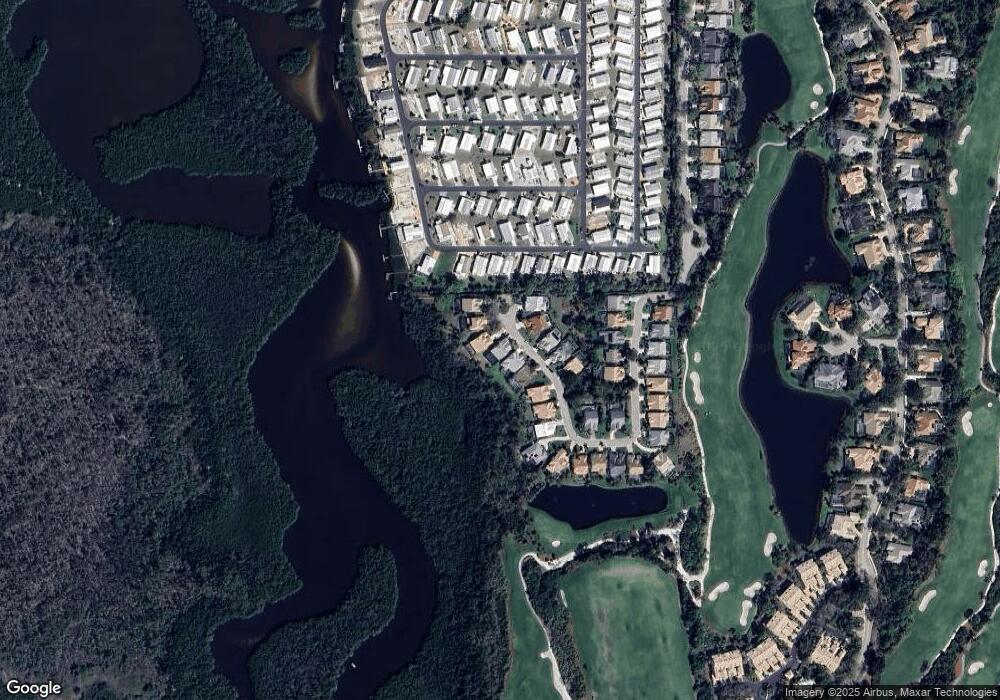
Map
Nearby Homes
- 25231 Bay Cedar Dr
- 25221 Bay Cedar Dr
- 25241 Bay Cedar Dr
- 25211 Bay Cedar Dr
- 25251 Bay Cedar Dr
- 25201 Bay Cedar Dr
- 25261 Bay Cedar Dr
- 25240 Bay Cedar Dr
- 25220 Bay Cedar Dr
- 25260 Bay Cedar Dr
- 25210 Bay Cedar Dr
- 25191 Bay Cedar Dr
- 25200 Bay Cedar Dr
- 25181 Bay Cedar Dr
- 4697 Tahiti Dr
- 4701 Tahiti Dr
- 4693 Tahiti Dr
- 4705 Tahiti Dr
- 4689 Tahiti Dr
- 4709 Tahiti Dr