Estimated Value: $361,000 - $1,271,000
2
Beds
1
Bath
1,288
Sq Ft
$491/Sq Ft
Est. Value
About This Home
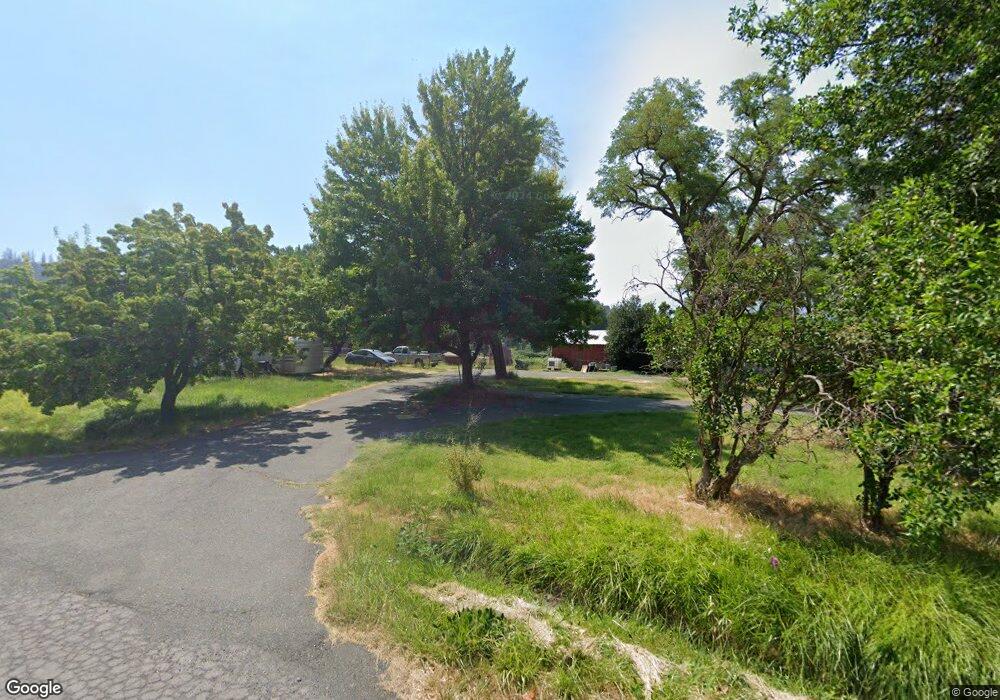
This home is located at 25235 Old Edgewood Rd, Weed, CA 96094 and is currently estimated at $632,831, approximately $491 per square foot. 25235 Old Edgewood Rd is a home located in Siskiyou County with nearby schools including Butteville Elementary School, Weed High School, and Siskiyou Christian School.
Ownership History
Date
Name
Owned For
Owner Type
Purchase Details
Closed on
Aug 14, 2017
Sold by
Massy Sylvia L and Shivy Sylvia
Bought by
Robertson Gillies B and Robertson Alexis V
Current Estimated Value
Home Financials for this Owner
Home Financials are based on the most recent Mortgage that was taken out on this home.
Original Mortgage
$147,160
Outstanding Balance
$122,661
Interest Rate
3.92%
Mortgage Type
Commercial
Estimated Equity
$510,170
Purchase Details
Closed on
Jan 2, 2014
Sold by
Shivy Gregory S
Bought by
Shivy Sylvia L Massy
Purchase Details
Closed on
Jul 5, 2001
Sold by
Shivy Gregory Steven
Bought by
Shivy Sylvia L
Home Financials for this Owner
Home Financials are based on the most recent Mortgage that was taken out on this home.
Original Mortgage
$48,000
Interest Rate
7.26%
Create a Home Valuation Report for This Property
The Home Valuation Report is an in-depth analysis detailing your home's value as well as a comparison with similar homes in the area
Home Values in the Area
Average Home Value in this Area
Purchase History
| Date | Buyer | Sale Price | Title Company |
|---|---|---|---|
| Robertson Gillies B | $300,000 | Mt Shasta Title & Escrow Co | |
| Shivy Sylvia L Massy | -- | None Available | |
| Shivy Sylvia L | -- | -- | |
| Shivy Sylvia L | $63,000 | -- |
Source: Public Records
Mortgage History
| Date | Status | Borrower | Loan Amount |
|---|---|---|---|
| Open | Robertson Gillies B | $147,160 | |
| Previous Owner | Shivy Sylvia L | $48,000 |
Source: Public Records
Tax History Compared to Growth
Tax History
| Year | Tax Paid | Tax Assessment Tax Assessment Total Assessment is a certain percentage of the fair market value that is determined by local assessors to be the total taxable value of land and additions on the property. | Land | Improvement |
|---|---|---|---|---|
| 2025 | $3,966 | $330,874 | $148,824 | $182,050 |
| 2023 | $3,966 | $318,028 | $143,046 | $174,982 |
| 2022 | $4,039 | $311,793 | $140,242 | $171,551 |
| 2021 | $3,946 | $305,681 | $137,493 | $168,188 |
| 2020 | $3,823 | $302,548 | $136,084 | $166,464 |
| 2019 | $3,700 | $296,616 | $133,416 | $163,200 |
| 2018 | $3,592 | $290,800 | $130,800 | $160,000 |
| 2017 | $3,245 | $257,564 | $172,155 | $85,409 |
| 2016 | $3,188 | $252,515 | $168,780 | $83,735 |
| 2015 | $3,153 | $248,723 | $166,245 | $82,478 |
| 2014 | $3,024 | $243,852 | $162,989 | $80,863 |
Source: Public Records
Map
Nearby Homes
- 26804 Edgewood Rd
- BTR 43n33
- Poplar Court
- Lot 37 Echo Ct Gleenwood Dr
- 7609 Juniper
- US HWY 97 Na
- Lot 172 Riverside Dr Unit 9-1
- Lot 232 Brazos Ct Unit 9-1
- Lot 44 Dwinnel Dr
- 22435 Old Highway 99
- 23205 Slough Rd
- 371 E Lincoln Ave
- 1220 Railroad Ave
- 4900 Jackson Ranch Rd
- 202 & 206 N Weed Blvd
- 767 N Davis Ave
- 202 - 206 N Weed Blvd
- 306 Woodridge Ct
- 648 S Davis Ave
- 456 Woodridge Ct
- 25235 Old Edgewood Rd
- 25331 Old Edgewood Rd
- 25235 Edgwood Rd
- 25147 & 25135 Edgewood Rd
- 25135 Edgewood Rd
- 25135 & 25147 Edgewood Rd
- 25335 Old Edgewood Rd
- 25408 Edgewood Rd
- 25509 Edgewood Rd
- 25235 Edgewood Edgewood Rd
- 24917 1st St
- 24900 1st St
- 25937 Old Edgewood Rd
- 25908 Old Highway 99
- 24739 Edgewood Rd
- 24911 1st St
- 24735 Edgewood Rd
- 24907 1st St
- 12801 N Old Stage Rd
- 26130 Edgewood Rd