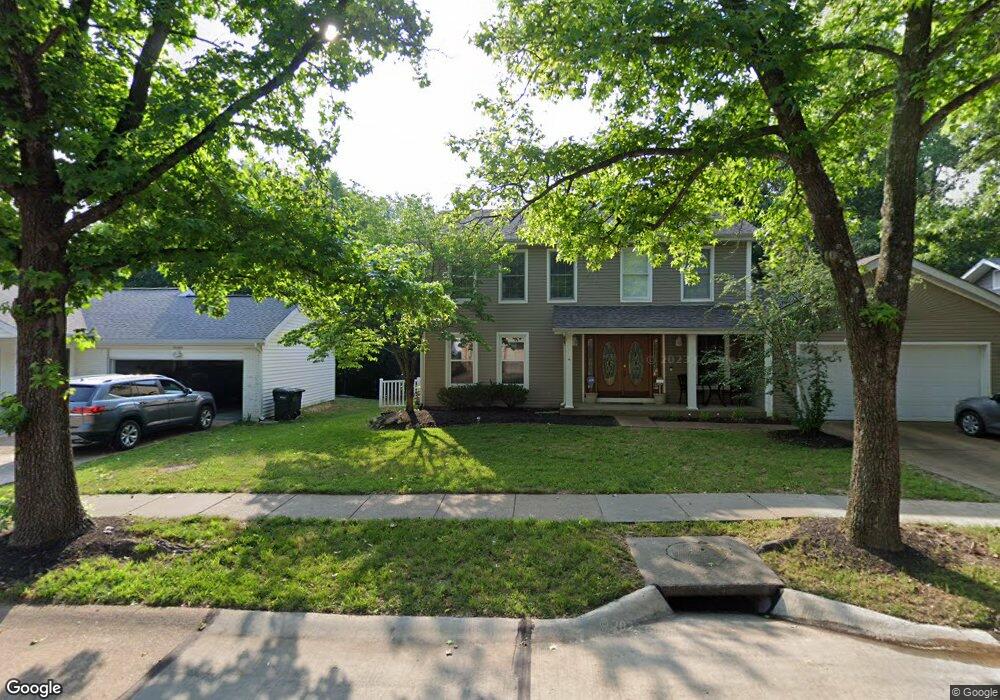
2524 Elm Forest Ct Ballwin, MO 63011
Estimated Value: $394,000 - $434,000
4
Beds
3
Baths
1,955
Sq Ft
$213/Sq Ft
Est. Value
About This Home
This home is located at 2524 Elm Forest Ct, Ballwin, MO 63011 and is currently estimated at $416,769, approximately $213 per square foot. 2524 Elm Forest Ct is a home located in St. Louis County with nearby schools including Green Pines Elementary School, Wildwood Middle School, and Lafayette High School.
Ownership History
Date
Name
Owned For
Owner Type
Purchase Details
Closed on
Sep 4, 2013
Sold by
Smith Laura J
Bought by
Smith Laura J
Current Estimated Value
Home Financials for this Owner
Home Financials are based on the most recent Mortgage that was taken out on this home.
Original Mortgage
$192,800
Outstanding Balance
$143,646
Interest Rate
4.36%
Mortgage Type
New Conventional
Estimated Equity
$273,123
Purchase Details
Closed on
Feb 23, 2001
Sold by
Smith Robert Dewey
Bought by
Smith Laura J
Purchase Details
Closed on
Feb 10, 1998
Sold by
Baier Richard C and Baier Laura A
Bought by
Smith Robert Dewey and Smith Laura J
Home Financials for this Owner
Home Financials are based on the most recent Mortgage that was taken out on this home.
Original Mortgage
$129,397
Interest Rate
6.91%
Mortgage Type
FHA
Create a Home Valuation Report for This Property
The Home Valuation Report is an in-depth analysis detailing your home's value as well as a comparison with similar homes in the area
Home Values in the Area
Average Home Value in this Area
Purchase History
| Date | Buyer | Sale Price | Title Company |
|---|---|---|---|
| Smith Laura J | -- | Chesterfield Title Agency | |
| Smith Laura J | -- | -- | |
| Smith Robert Dewey | -- | -- |
Source: Public Records
Mortgage History
| Date | Status | Borrower | Loan Amount |
|---|---|---|---|
| Open | Smith Laura J | $192,800 | |
| Closed | Smith Robert Dewey | $129,397 |
Source: Public Records
Tax History Compared to Growth
Tax History
| Year | Tax Paid | Tax Assessment Tax Assessment Total Assessment is a certain percentage of the fair market value that is determined by local assessors to be the total taxable value of land and additions on the property. | Land | Improvement |
|---|---|---|---|---|
| 2025 | $4,365 | $62,260 | $26,600 | $35,660 |
| 2024 | $4,365 | $62,780 | $19,950 | $42,830 |
| 2023 | $4,362 | $62,780 | $19,950 | $42,830 |
| 2022 | $3,897 | $52,100 | $16,630 | $35,470 |
| 2021 | $3,869 | $52,100 | $16,630 | $35,470 |
| 2020 | $3,758 | $48,260 | $14,970 | $33,290 |
| 2019 | $3,774 | $48,260 | $14,970 | $33,290 |
| 2018 | $3,678 | $44,360 | $12,460 | $31,900 |
| 2017 | $3,591 | $44,360 | $12,460 | $31,900 |
| 2016 | $3,262 | $38,760 | $10,810 | $27,950 |
| 2015 | $3,196 | $38,760 | $10,810 | $27,950 |
| 2014 | $3,113 | $36,820 | $8,360 | $28,460 |
Source: Public Records
Map
Nearby Homes
- 2531 Elm Forest Ct
- 2551 Forest Leaf Pkwy
- 2452 Autumn Pines Dr
- 110 Sweet Cherry Way
- 116 Sweet Cherry Way
- 16621 Green Pines Dr
- 112 Boathouse Dr
- 2308 Sand Cherry Dr
- 16307 Autumn View Terrace Dr
- 375 Thunderhead Canyon Dr
- 16672 Westglen Farms Dr
- 2381 Gross Point Ln
- 16509 Carriage View Ct
- 16567 Thunderhead Canyon Ct
- 16549 Carriage View Ct
- 2424 Eatherton Rd
- 160 Jubilee Hill Dr Unit G
- 123 Carriage View Dr
- 2003 Centennial Ct
- 16518 Victoria Crossing Dr Unit B
- 2528 Elm Forest Ct
- 2520 Elm Forest Ct
- 2516 Elm Forest Ct
- 2523 Elm Forest Ct
- 2527 Elm Forest Ct
- 16444 Baja Ct
- 2519 Elm Forest Ct
- 16440 Baja Ct
- 16448 Baja Ct
- 16436 Baja Ct
- 2536 Elm Forest Ct
- 2512 Elm Forest Ct
- 2515 Elm Forest Ct
- 16432 Baja Ct
- 2535 Elm Forest Ct
- 16428 Baja Ct
- 2511 Elm Forest Ct
- 2542 Elm Forest Ct
- 2508 Elm Forest Ct
- 2539 Elm Forest Ct