2524 Ruette Nice La Jolla, CA 92037
La Jolla Shores NeighborhoodEstimated Value: $7,921,000 - $8,856,000
4
Beds
5
Baths
4,575
Sq Ft
$1,828/Sq Ft
Est. Value
About This Home
This home is located at 2524 Ruette Nice, La Jolla, CA 92037 and is currently estimated at $8,361,940, approximately $1,827 per square foot. 2524 Ruette Nice is a home located in San Diego County with nearby schools including Torrey Pines Elementary School, Muirlands Middle School, and La Jolla High School.
Ownership History
Date
Name
Owned For
Owner Type
Purchase Details
Closed on
Jul 13, 2021
Sold by
Wechter Kevin A and The Aaron Wechter & Sylvia Wec
Bought by
2524 Rn Llc
Current Estimated Value
Purchase Details
Closed on
Aug 22, 2013
Sold by
Wechter Sylvia
Bought by
Wechter Sylvia
Purchase Details
Closed on
Feb 18, 2000
Sold by
Southfield 79 L L C
Bought by
Wechter Aaron and Wechter Sylvia
Purchase Details
Closed on
Jun 28, 1996
Sold by
Cohen Joshua and Cohen Lyda
Bought by
Southfield 79 Llc
Purchase Details
Closed on
Jun 14, 1996
Sold by
Southfield 79 Llc
Bought by
Cohen Joshua and Cohen Lyda
Purchase Details
Closed on
May 22, 1996
Sold by
Young John E and Young Carolyn J
Bought by
Southfield 79 Llc
Purchase Details
Closed on
Aug 29, 1986
Create a Home Valuation Report for This Property
The Home Valuation Report is an in-depth analysis detailing your home's value as well as a comparison with similar homes in the area
Home Values in the Area
Average Home Value in this Area
Purchase History
We collect this data history from publicly available records. To have your information removed, we recommend requesting removal directly through your county’s website.
| Date | Buyer | Sale Price | Title Company |
|---|---|---|---|
| 2524 Rn Llc | $7,185,000 | Chicago Title Company | |
| Wechter Sylvia | -- | None Available | |
| Wechter Aaron | -- | Chicago Title Co | |
| Southfield 79 Llc | $700,000 | First American Title | |
| Cohen Joshua | -- | -- | |
| Southfield 79 Llc | $550,000 | First American Title | |
| -- | $375,000 | -- |
Source: Public Records
Tax History
| Year | Tax Paid | Tax Assessment Tax Assessment Total Assessment is a certain percentage of the fair market value that is determined by local assessors to be the total taxable value of land and additions on the property. | Land | Improvement |
|---|---|---|---|---|
| 2025 | $91,835 | $7,624,779 | $5,306,040 | $2,318,739 |
| 2024 | $91,835 | $7,475,274 | $5,202,000 | $2,273,274 |
| 2023 | $89,817 | $7,328,700 | $5,100,000 | $2,228,700 |
| 2022 | $87,428 | $7,185,000 | $5,000,000 | $2,185,000 |
| 2021 | $45,392 | $3,681,199 | $2,079,570 | $1,601,629 |
| 2020 | $44,841 | $3,643,454 | $2,058,247 | $1,585,207 |
| 2019 | $44,040 | $3,572,015 | $2,017,890 | $1,554,125 |
| 2018 | $41,167 | $3,501,976 | $1,978,324 | $1,523,652 |
| 2017 | $80 | $3,433,311 | $1,939,534 | $1,493,777 |
| 2016 | $39,557 | $3,365,992 | $1,901,504 | $1,464,488 |
| 2015 | $38,972 | $3,315,433 | $1,872,942 | $1,442,491 |
| 2014 | $38,354 | $3,250,489 | $1,836,254 | $1,414,235 |
Source: Public Records
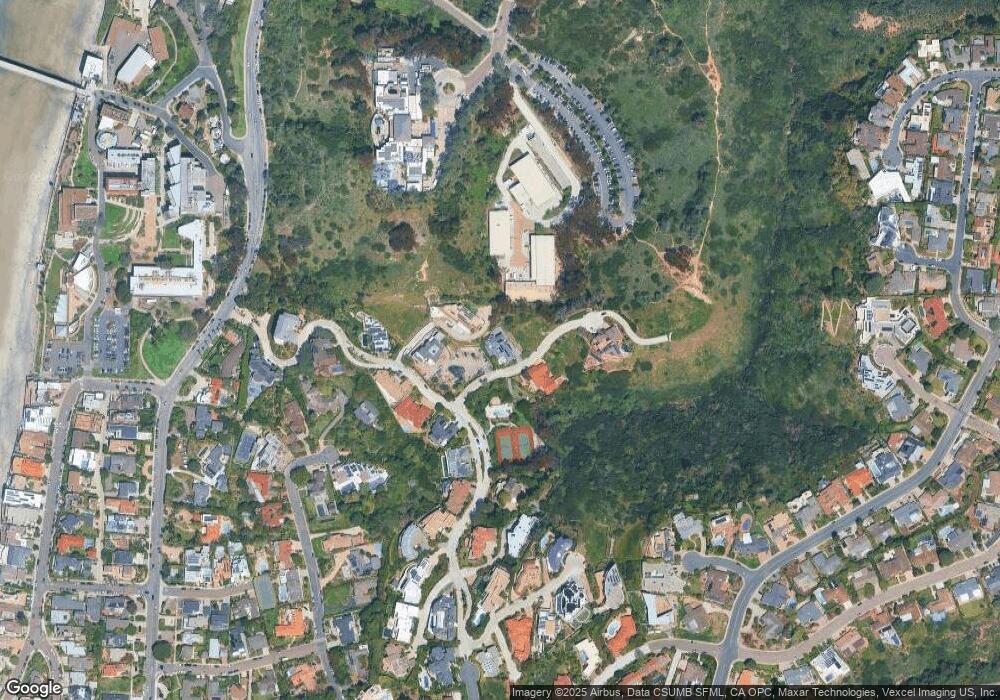
Map
Nearby Homes
- 2516 Ruette Nicole
- 8504 Prestwick Dr
- 2320 Camino Del Collado
- 8430 Whale Watch Way
- 8675 Glenwick Ln
- 8433 Prestwick Dr
- 8361 Calle Del Cielo
- 8477 El Paseo Grande Unit Share 3
- 8477 El Paseo Grande Unit 4
- 8330 Prestwick Dr
- 8305 Calle Del Cielo
- 8308 Calle Del Cielo
- 8314 Paseo Del Ocaso
- 8390 Cliffridge Ln
- 8575 La Jolla Scenic Dr N
- 8260 Paseo Del Ocaso
- 2586 Calle Del Oro
- 2615 Ellentown Rd
- 8238 Paseo Del Ocaso
- 8358 Caminito Helecho
- 8619 Ruette Monte Carlo
- 2525 Ruette Nice
- 0 Ruette Monte Carlo Unit 42 130040480
- 8611 Ruette Monte Carlo
- 2555 Ruette Nice
- 8598 Ruette Monte Carlo
- 8606 Ruette Monte Carlo
- 8616 Ruette Monte Carlo
- 8588 Ruette Monte Carlo
- 8633 Ruette Monte Carlo
- 8575 Ruette Monte Carlo
- 2336 Calle Chiquita
- 8578 Ruette Monte Carlo
- 8636 Ruette Monte Carlo
- 2326 Calle Chiquita
- 8568 Ruette Monte Carlo
- 8545 Ruette Monte Carlo
- 8555 Ruette Monte Carlo
- 2337 Calle Chiquita
- 2526 Ruette Nicole
Your Personal Tour Guide
Ask me questions while you tour the home.