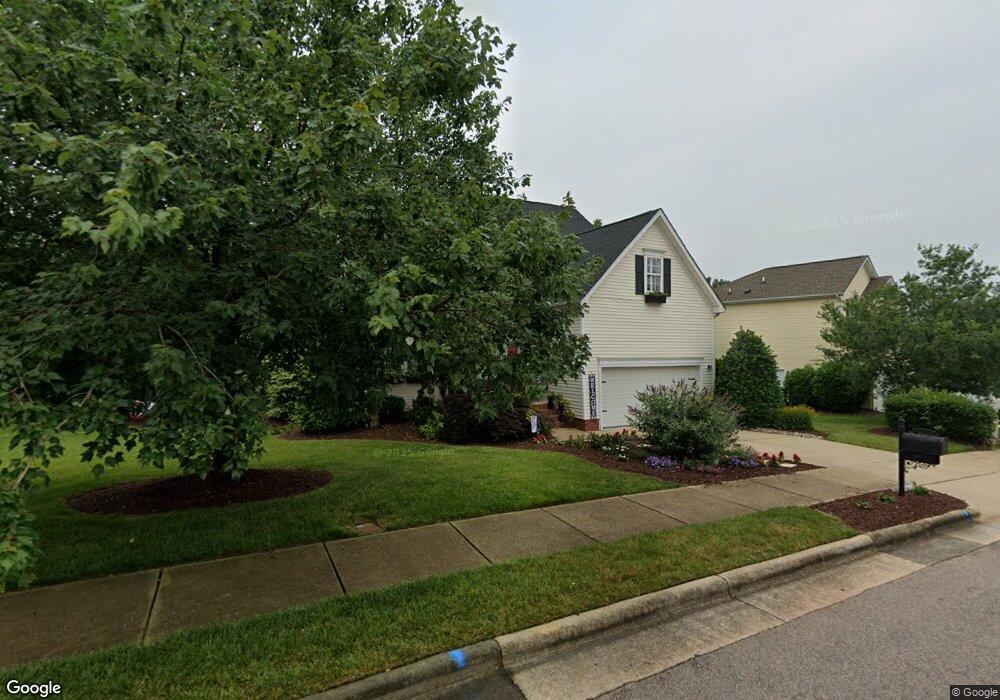
2524 Spruce Shadows Ln Raleigh, NC 27614
Falls Lake NeighborhoodEstimated Value: $388,000 - $443,657
3
Beds
3
Baths
1,712
Sq Ft
$247/Sq Ft
Est. Value
About This Home
This home is located at 2524 Spruce Shadows Ln, Raleigh, NC 27614 and is currently estimated at $422,664, approximately $246 per square foot. 2524 Spruce Shadows Ln is a home located in Wake County with nearby schools including Wakefield Elementary School, Wakefield Middle, and Wakefield High School.
Ownership History
Date
Name
Owned For
Owner Type
Purchase Details
Closed on
Jul 15, 2014
Sold by
Harris Tracie L and Rice Brian L
Bought by
Rice Brian L and Rice Tracie Harris
Current Estimated Value
Home Financials for this Owner
Home Financials are based on the most recent Mortgage that was taken out on this home.
Original Mortgage
$173,550
Outstanding Balance
$132,589
Interest Rate
4.24%
Mortgage Type
New Conventional
Estimated Equity
$290,075
Purchase Details
Closed on
Jul 12, 2002
Sold by
Don Galloway Homes Llc
Bought by
Harris Tracie L
Home Financials for this Owner
Home Financials are based on the most recent Mortgage that was taken out on this home.
Original Mortgage
$140,000
Interest Rate
6.53%
Purchase Details
Closed on
Dec 20, 2001
Sold by
Landmark Homes Inc
Bought by
Don Galloway Homes Llc
Create a Home Valuation Report for This Property
The Home Valuation Report is an in-depth analysis detailing your home's value as well as a comparison with similar homes in the area
Home Values in the Area
Average Home Value in this Area
Purchase History
| Date | Buyer | Sale Price | Title Company |
|---|---|---|---|
| Rice Brian L | -- | None Available | |
| Harris Tracie L | $192,000 | -- | |
| Don Galloway Homes Llc | $17,739,500 | -- |
Source: Public Records
Mortgage History
| Date | Status | Borrower | Loan Amount |
|---|---|---|---|
| Open | Rice Brian L | $173,550 | |
| Previous Owner | Harris Tracie L | $140,000 |
Source: Public Records
Tax History Compared to Growth
Tax History
| Year | Tax Paid | Tax Assessment Tax Assessment Total Assessment is a certain percentage of the fair market value that is determined by local assessors to be the total taxable value of land and additions on the property. | Land | Improvement |
|---|---|---|---|---|
| 2025 | $3,659 | $417,298 | $120,000 | $297,298 |
| 2024 | $3,644 | $417,298 | $120,000 | $297,298 |
| 2023 | $2,985 | $272,044 | $53,000 | $219,044 |
| 2022 | $2,774 | $272,044 | $53,000 | $219,044 |
| 2021 | $2,667 | $272,044 | $53,000 | $219,044 |
| 2020 | $2,619 | $272,044 | $53,000 | $219,044 |
| 2019 | $2,629 | $225,118 | $40,000 | $185,118 |
| 2018 | $2,480 | $225,118 | $40,000 | $185,118 |
| 2017 | $2,362 | $225,118 | $40,000 | $185,118 |
| 2016 | $2,314 | $225,118 | $40,000 | $185,118 |
| 2015 | $2,523 | $241,683 | $55,000 | $186,683 |
| 2014 | -- | $241,683 | $55,000 | $186,683 |
Source: Public Records
Map
Nearby Homes
- 2561 Bent Green St
- 2738 Garden Knoll Ln
- 2536 Bent Green St
- 2545 Forest Shadows Ln
- 2220 Spruce Shadows Ln
- 3220 Queensland Rd
- 2822 Winter Song Rd
- 13201 Townfield Dr
- 3328 Queensland Rd
- 2116 Covered Bridge Ct
- 3428 van Hessen Dr
- 2704 Snowy Meadow Ct
- 12204 Kaysmount Ct
- 3436 Falls River Ave
- 12301 Corvus Rd
- 2728 Cloud Mist Cir
- 12308 Bunchgrass Ln
- 10701 Royal Forrest Dr
- 12400 Village Gate Way
- 2740 Cloud Mist Cir
- 2520 Spruce Shadows Ln
- 2516 Spruce Shadows Ln
- 2600 Garden Knoll Ln
- 2533 Spruce Shadows Ln
- 12533 Spruce Tree Way
- 2529 Spruce Shadows Ln
- 2602 Garden Knoll Ln
- 2604 Garden Knoll Ln
- 2525 Spruce Shadows Ln
- 2512 Spruce Shadows Ln
- 2521 Spruce Shadows Ln
- 2611 Garden Knoll Ln
- 2613 Garden Knoll Ln
- 2517 Spruce Shadows Ln
- 2603 Vega Ct
- 12540 Spruce Tree Way
- 2605 Vega Ct
- 2508 Spruce Shadows Ln
- 2540 Springfield Park Dr
- 2609 Vega Ct