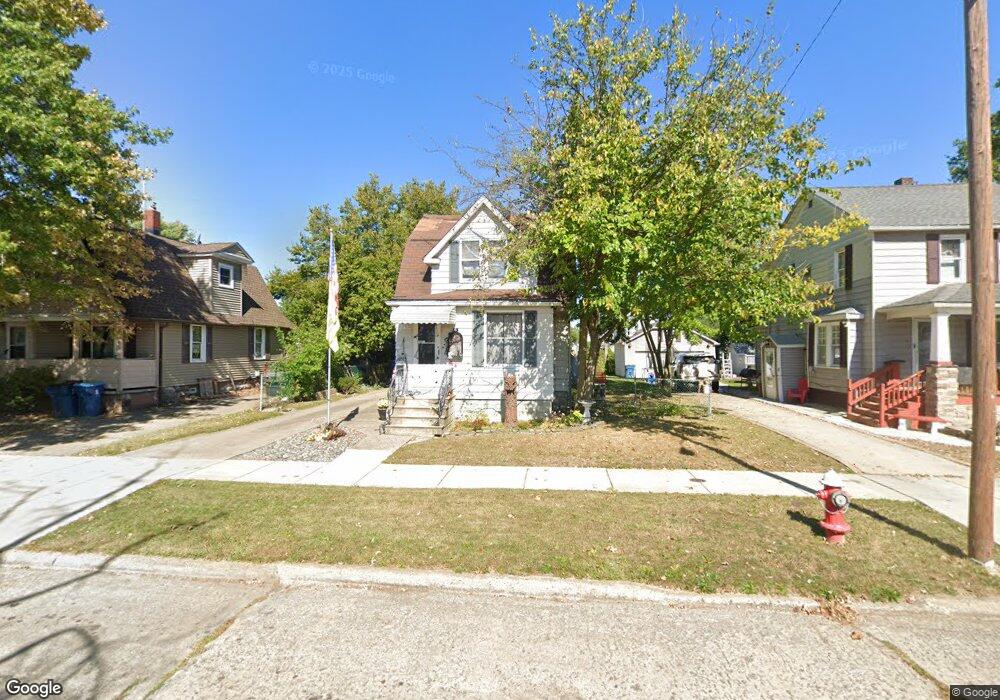
2525 E 34th St Lorain, OH 44055
Estimated Value: $110,812 - $155,000
2
Beds
1
Bath
906
Sq Ft
$145/Sq Ft
Est. Value
About This Home
This home is located at 2525 E 34th St, Lorain, OH 44055 and is currently estimated at $131,203, approximately $144 per square foot. 2525 E 34th St is a home located in Lorain County with nearby schools including Palm Elementary School, Southview Middle School, and Lorain High School.
Ownership History
Date
Name
Owned For
Owner Type
Purchase Details
Closed on
Mar 3, 2017
Sold by
Carrington Mortgage Services Llc
Bought by
Middlebranch Acquisitions Llc
Current Estimated Value
Purchase Details
Closed on
Jan 17, 2017
Sold by
Lorain County Sheriff
Bought by
Carrington Mortgage Services Llc
Purchase Details
Closed on
Apr 20, 1999
Sold by
Schmieler Robert H and Schmieler Kathleen D
Bought by
Weber Mark L
Home Financials for this Owner
Home Financials are based on the most recent Mortgage that was taken out on this home.
Original Mortgage
$54,141
Interest Rate
7.05%
Mortgage Type
FHA
Purchase Details
Closed on
Aug 9, 1995
Sold by
Bogatschow Erna
Bought by
Schmieler Robert H and Schmieler Kathleen D
Home Financials for this Owner
Home Financials are based on the most recent Mortgage that was taken out on this home.
Original Mortgage
$34,400
Interest Rate
7.51%
Mortgage Type
New Conventional
Create a Home Valuation Report for This Property
The Home Valuation Report is an in-depth analysis detailing your home's value as well as a comparison with similar homes in the area
Home Values in the Area
Average Home Value in this Area
Purchase History
| Date | Buyer | Sale Price | Title Company |
|---|---|---|---|
| Middlebranch Acquisitions Llc | $2,100 | Advantage Title | |
| Carrington Mortgage Services Llc | $20,100 | -- | |
| Weber Mark L | $54,200 | Guardian Title | |
| Schmieler Robert H | $43,000 | -- |
Source: Public Records
Mortgage History
| Date | Status | Borrower | Loan Amount |
|---|---|---|---|
| Previous Owner | Weber Mark L | $54,141 | |
| Previous Owner | Schmieler Robert H | $34,400 |
Source: Public Records
Tax History
| Year | Tax Paid | Tax Assessment Tax Assessment Total Assessment is a certain percentage of the fair market value that is determined by local assessors to be the total taxable value of land and additions on the property. | Land | Improvement |
|---|---|---|---|---|
| 2024 | $1,218 | $28,816 | $3,920 | $24,896 |
| 2023 | $687 | $13,010 | $4,064 | $8,946 |
| 2022 | $681 | $13,010 | $4,064 | $8,946 |
| 2021 | $681 | $13,010 | $4,060 | $8,950 |
| 2020 | $631 | $10,470 | $3,270 | $7,200 |
| 2019 | $628 | $10,470 | $3,270 | $7,200 |
| 2018 | $628 | $10,470 | $3,270 | $7,200 |
| 2017 | $938 | $15,130 | $4,030 | $11,100 |
| 2016 | $931 | $15,130 | $4,030 | $11,100 |
| 2015 | $878 | $15,130 | $4,030 | $11,100 |
| 2014 | $838 | $14,470 | $3,850 | $10,620 |
| 2013 | $831 | $14,470 | $3,850 | $10,620 |
Source: Public Records
Map
Nearby Homes
- 3308 Norfolk Ave
- 2217 E 32nd St
- 2228 E 30th St
- 4061 Gregus Ave
- 2129 E 30th St
- 4510 Riverside Dr
- V/L Grove Ave
- 4617 Andover Ave
- 4608 Gary Ave
- V/L Clinton Ave
- 1951 E 39th St
- 1924 E 33rd St
- 4210 Seneca Ave
- 1829 E 33rd St
- 1816 E 34th St
- VL Ridgewood St
- 5193 Liberty Ave
- V/L Pearl Ave
- V/L Rear Land Unit 1
- V/L Rear Land Unit 2
Your Personal Tour Guide
Ask me questions while you tour the home.