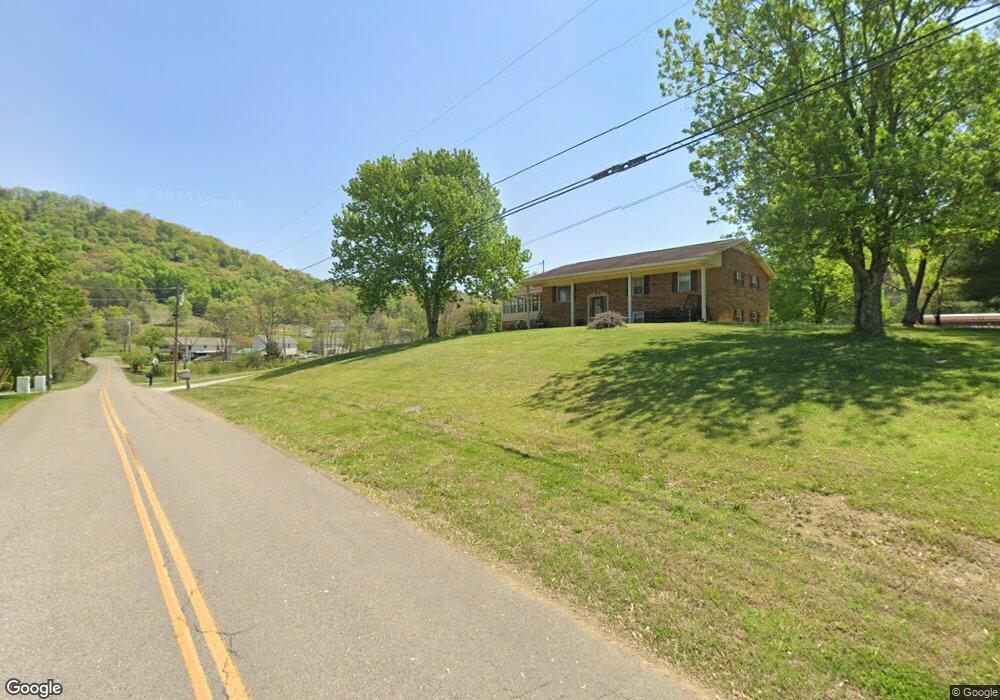
2525 Kidwell Church Rd Morristown, TN 37814
Estimated Value: $234,000 - $363,000
--
Bed
2
Baths
1,170
Sq Ft
$249/Sq Ft
Est. Value
About This Home
This home is located at 2525 Kidwell Church Rd, Morristown, TN 37814 and is currently estimated at $291,197, approximately $248 per square foot. 2525 Kidwell Church Rd is a home located in Hamblen County with nearby schools including Manley Elementary School, West View Middle School, and Morristown West High School.
Ownership History
Date
Name
Owned For
Owner Type
Purchase Details
Closed on
Jun 1, 2018
Sold by
Noel Lori Lynn
Bought by
Skeen John T
Current Estimated Value
Home Financials for this Owner
Home Financials are based on the most recent Mortgage that was taken out on this home.
Original Mortgage
$110,500
Outstanding Balance
$66,067
Interest Rate
4.4%
Mortgage Type
Unknown
Estimated Equity
$225,130
Purchase Details
Closed on
Jan 11, 1988
Bought by
Noel James A and Noel Helen
Purchase Details
Closed on
Nov 2, 1987
Bought by
Secretary Of H U D 1 North Shore Bldg
Purchase Details
Closed on
Sep 17, 1987
Bought by
Commonwealth Mortgage Corp
Purchase Details
Closed on
Mar 2, 1986
Bought by
Inman Bobby D and Inman Betty R
Create a Home Valuation Report for This Property
The Home Valuation Report is an in-depth analysis detailing your home's value as well as a comparison with similar homes in the area
Home Values in the Area
Average Home Value in this Area
Purchase History
| Date | Buyer | Sale Price | Title Company |
|---|---|---|---|
| Skeen John T | $130,000 | None Available | |
| Noel James A | $48,200 | -- | |
| Secretary Of H U D 1 North Shore Bldg | $56,900 | -- | |
| Commonwealth Mortgage Corp | $56,900 | -- | |
| Inman Bobby D | $56,400 | -- |
Source: Public Records
Mortgage History
| Date | Status | Borrower | Loan Amount |
|---|---|---|---|
| Open | Skeen John T | $110,500 |
Source: Public Records
Tax History Compared to Growth
Tax History
| Year | Tax Paid | Tax Assessment Tax Assessment Total Assessment is a certain percentage of the fair market value that is determined by local assessors to be the total taxable value of land and additions on the property. | Land | Improvement |
|---|---|---|---|---|
| 2024 | $728 | $36,975 | $4,600 | $32,375 |
| 2023 | $728 | $36,975 | $0 | $0 |
| 2022 | $728 | $36,975 | $4,600 | $32,375 |
| 2021 | $728 | $36,975 | $4,600 | $32,375 |
| 2020 | $728 | $36,975 | $4,600 | $32,375 |
| 2019 | $732 | $34,350 | $4,600 | $29,750 |
| 2018 | $684 | $34,350 | $4,600 | $29,750 |
| 2017 | $684 | $34,350 | $4,600 | $29,750 |
| 2016 | $684 | $34,350 | $4,600 | $29,750 |
| 2015 | $635 | $34,350 | $4,600 | $29,750 |
| 2014 | -- | $34,350 | $4,600 | $29,750 |
| 2013 | -- | $41,200 | $0 | $0 |
Source: Public Records
Map
Nearby Homes
- 3095 Misty Hill Ln
- 3844 Isaac Ave
- 3902 Isaac Ave
- 1995 Bluebird Cir
- 1987 Joe Stephens Rd
- 1855 Joe Stephens Rd
- 2350 Joe Stephens Rd
- 1540 Kidwell Ridge Rd
- 1701 Old Oak Ln
- 1335 Joe Stephens Rd
- 1466 Dandelion Cir
- 1465 Wind Crest Dr
- TBD Rambling Rd
- 3415 Emerald Ave
- 0 Mcbride Rd
- 1121 Hickory View Dr
- 3864 Apostle Rd
- Lot 104 Red Cloud Ln
- 4193 Scarlett Dr
- 1074 Hickory View Dr
- 2515 Kidwells Ridge Rd
- 2322 Covington Dr
- 2533 Kidwell Church Rd
- 2328 Covington Dr
- 2332 Covington Dr
- 2512 Kidwell Church Rd
- 2524 Kidwell Church Rd
- Lot 1 Covington Dr
- 2346 Covington Dr
- 2522 Kidwell Church Rd
- 2321 Covington Dr
- 2338 Covington Dr
- 2539 Kidwell Church Rd
- 2945 Inman Bend Rd
- 2518 Kidwell Church Rd
- 2532 Kidwell Church Rd
- 2935 Inman Bend Rd
- 3015 Misty Hill Ln
- 2925 Inman Bend Rd
- 2341 Covington Dr