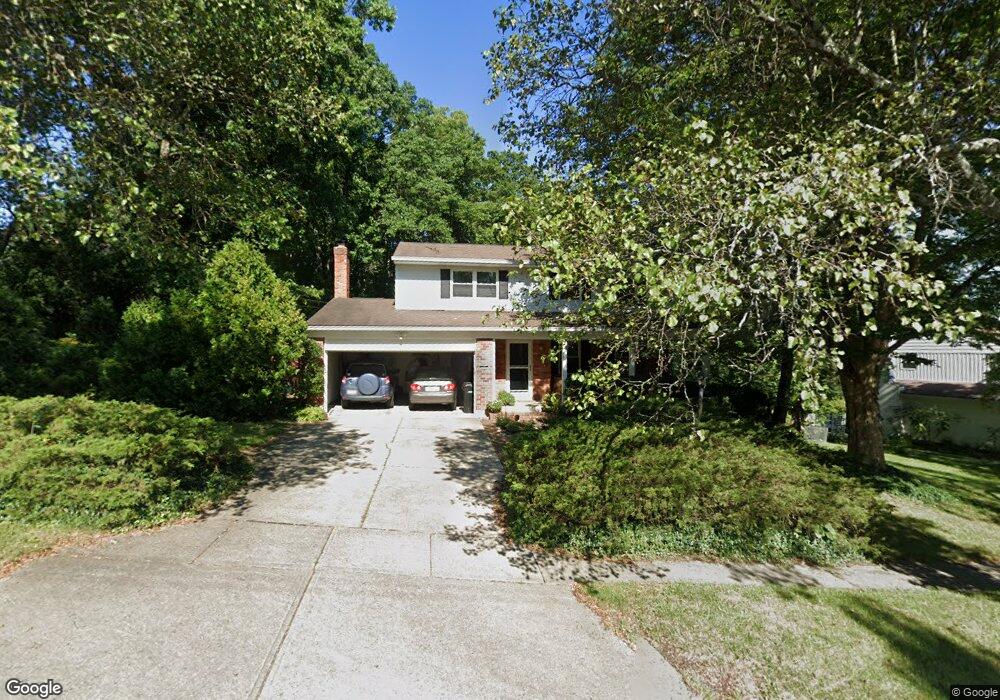
2525 Ranchvale Dr Cincinnati, OH 45230
Mount Washington NeighborhoodEstimated Value: $310,000 - $376,000
4
Beds
3
Baths
1,759
Sq Ft
$193/Sq Ft
Est. Value
About This Home
This home is located at 2525 Ranchvale Dr, Cincinnati, OH 45230 and is currently estimated at $340,318, approximately $193 per square foot. 2525 Ranchvale Dr is a home located in Hamilton County with nearby schools including Mt. Washington Elementary School, Clark Montessori High School, and Shroder High School.
Ownership History
Date
Name
Owned For
Owner Type
Purchase Details
Closed on
Jul 3, 2013
Sold by
Swanson Chuck W
Bought by
Swanson Chuck W and Tayko Dolores Gail
Current Estimated Value
Home Financials for this Owner
Home Financials are based on the most recent Mortgage that was taken out on this home.
Original Mortgage
$102,500
Outstanding Balance
$73,531
Interest Rate
3.91%
Mortgage Type
New Conventional
Estimated Equity
$266,787
Purchase Details
Closed on
Nov 24, 2004
Sold by
Keiser Howard T
Bought by
Swanson Chuck W
Home Financials for this Owner
Home Financials are based on the most recent Mortgage that was taken out on this home.
Original Mortgage
$112,500
Interest Rate
5.82%
Mortgage Type
Balloon
Purchase Details
Closed on
Jun 1, 1998
Sold by
Keiser Howard T
Bought by
Keiser Mary Elaine
Create a Home Valuation Report for This Property
The Home Valuation Report is an in-depth analysis detailing your home's value as well as a comparison with similar homes in the area
Home Values in the Area
Average Home Value in this Area
Purchase History
| Date | Buyer | Sale Price | Title Company |
|---|---|---|---|
| Swanson Chuck W | -- | Attorney | |
| Swanson Chuck W | -- | Cambridge Land Title Agency | |
| Keiser Mary Elaine | -- | -- |
Source: Public Records
Mortgage History
| Date | Status | Borrower | Loan Amount |
|---|---|---|---|
| Open | Swanson Chuck W | $102,500 | |
| Closed | Swanson Chuck W | $112,500 |
Source: Public Records
Tax History
| Year | Tax Paid | Tax Assessment Tax Assessment Total Assessment is a certain percentage of the fair market value that is determined by local assessors to be the total taxable value of land and additions on the property. | Land | Improvement |
|---|---|---|---|---|
| 2025 | $4,333 | $80,056 | $16,944 | $63,112 |
| 2023 | $4,918 | $80,056 | $16,944 | $63,112 |
| 2022 | $4,737 | $69,139 | $13,797 | $55,342 |
| 2021 | $4,551 | $69,139 | $13,797 | $55,342 |
| 2020 | $4,683 | $69,139 | $13,797 | $55,342 |
| 2019 | $4,615 | $60,648 | $12,103 | $48,545 |
| 2018 | $4,622 | $60,648 | $12,103 | $48,545 |
| 2017 | $4,396 | $60,648 | $12,103 | $48,545 |
| 2016 | $3,916 | $54,782 | $12,103 | $42,679 |
| 2015 | $3,532 | $54,782 | $12,103 | $42,679 |
| 2014 | $3,557 | $54,782 | $12,103 | $42,679 |
| 2013 | $3,618 | $54,782 | $12,103 | $42,679 |
Source: Public Records
Map
Nearby Homes
- 5459 Hanover Cir
- 2605 Bonnie Dr
- 2779 Redfield Place
- 5327 Reserve Cir
- 6253 Sturdy Ave
- 2121 Sutton Ave
- 6050 Bagdad Dr
- 2111 Sutton Ave
- 2127 Oxford Ave Unit 10
- 1944 Rockland Ave
- 6258 Benneville St
- 6362 Stirrup Rd
- 1776 Wilaray Terrace
- 1741 Mears Ave
- 2669 Newtown Rd
- 6123 Cambridge Ave
- 1630 Dell Terrace
- 1508 Beth Ln
- 255 St Peters St
- 257 St Peters St
- 2535 Ranchvale Dr
- 2515 Ranchvale Dr
- 2528 Ranchvale Dr
- 2522 Ranchvale Dr
- 2524 Elmdale Dr
- 2545 Ranchvale Dr
- 2536 Elmdale Dr
- 2514 Elmdale Dr
- 2503 Ranchvale Dr
- 5532 Wasigo Dr
- 2514 Ranchvale Dr
- 2544 Ranchvale Dr
- 2548 Elmdale Dr
- 5560 Wasigo Dr
- 5520 Wasigo Dr
- 5473 Beechmont Ave
- 5562 Wasigo Dr
- 2511 Wenatchee Ln
- 2505 Wenatchee Ln
- 2499 Wenatchee Ln
Your Personal Tour Guide
Ask me questions while you tour the home.