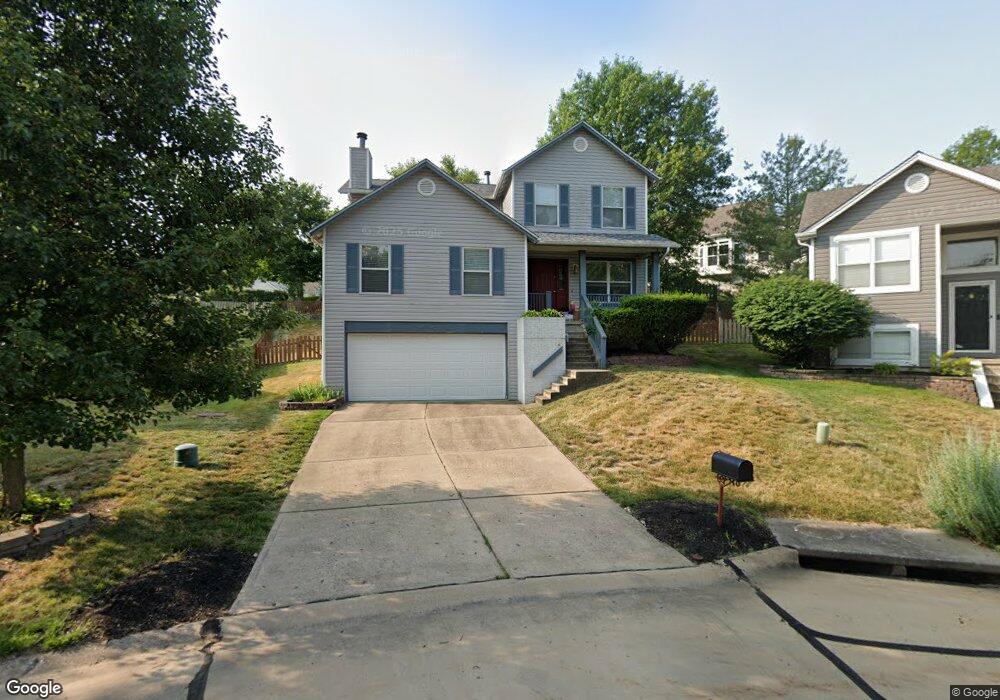
2526 Balaji Ct Ballwin, MO 63011
Estimated Value: $390,150 - $414,000
3
Beds
3
Baths
1,808
Sq Ft
$221/Sq Ft
Est. Value
About This Home
This home is located at 2526 Balaji Ct, Ballwin, MO 63011 and is currently estimated at $399,288, approximately $220 per square foot. 2526 Balaji Ct is a home located in St. Louis County with nearby schools including Green Pines Elementary School, Wildwood Middle School, and Lafayette High School.
Ownership History
Date
Name
Owned For
Owner Type
Purchase Details
Closed on
Sep 23, 2017
Sold by
Durnett Jason C
Bought by
Durnett Jason C and Smiley Deborah J
Current Estimated Value
Purchase Details
Closed on
Jun 24, 2009
Sold by
Durnett Jason C
Bought by
Durnett Jason C and Jcd Living Trust
Home Financials for this Owner
Home Financials are based on the most recent Mortgage that was taken out on this home.
Original Mortgage
$168,800
Outstanding Balance
$107,796
Interest Rate
4.97%
Mortgage Type
New Conventional
Estimated Equity
$291,492
Purchase Details
Closed on
May 27, 1999
Sold by
Giii Callahan James and Giii Melissa R
Bought by
Durnett Jason C
Home Financials for this Owner
Home Financials are based on the most recent Mortgage that was taken out on this home.
Original Mortgage
$145,400
Interest Rate
6.91%
Create a Home Valuation Report for This Property
The Home Valuation Report is an in-depth analysis detailing your home's value as well as a comparison with similar homes in the area
Home Values in the Area
Average Home Value in this Area
Purchase History
| Date | Buyer | Sale Price | Title Company |
|---|---|---|---|
| Durnett Jason C | -- | None Available | |
| Durnett Jason C | -- | None Available | |
| Durnett Jason C | $149,900 | -- |
Source: Public Records
Mortgage History
| Date | Status | Borrower | Loan Amount |
|---|---|---|---|
| Open | Durnett Jason C | $168,800 | |
| Closed | Durnett Jason C | $145,400 |
Source: Public Records
Tax History Compared to Growth
Tax History
| Year | Tax Paid | Tax Assessment Tax Assessment Total Assessment is a certain percentage of the fair market value that is determined by local assessors to be the total taxable value of land and additions on the property. | Land | Improvement |
|---|---|---|---|---|
| 2025 | $3,972 | $63,940 | $25,120 | $38,820 |
| 2024 | $3,972 | $57,120 | $18,850 | $38,270 |
| 2023 | $3,972 | $57,120 | $18,850 | $38,270 |
| 2022 | $3,116 | $41,650 | $12,540 | $29,110 |
| 2021 | $3,093 | $41,650 | $12,540 | $29,110 |
| 2020 | $3,010 | $38,650 | $11,290 | $27,360 |
| 2019 | $3,022 | $38,650 | $11,290 | $27,360 |
| 2018 | $2,955 | $35,630 | $9,410 | $26,220 |
| 2017 | $2,884 | $35,630 | $9,410 | $26,220 |
| 2016 | $2,749 | $32,660 | $8,150 | $24,510 |
| 2015 | $2,693 | $32,660 | $8,150 | $24,510 |
| 2014 | $2,663 | $31,500 | $7,560 | $23,940 |
Source: Public Records
Map
Nearby Homes
- 2531 Elm Forest Ct
- 2452 Autumn Pines Dr
- 2551 Forest Leaf Pkwy
- 112 Boathouse Dr
- 116 Sweet Cherry Way
- 16307 Autumn View Terrace Dr
- 375 Thunderhead Canyon Dr
- 16621 Green Pines Dr
- 424 Saint Thomas Isle Ln
- 16567 Thunderhead Canyon Ct
- 16672 Westglen Farms Dr
- 16509 Carriage View Ct
- 2308 Sand Cherry Dr
- 2381 Gross Point Ln
- 2003 Centennial Ct
- 16549 Carriage View Ct
- 160 Jubilee Hill Dr Unit G
- 16518 Victoria Crossing Dr Unit B
- 16166 Port of Nantucket Dr
- 249 Beacon Point Ln
- 2522 Balaji Ct
- 16419 Newpoint Ct
- 2527 Balaji Ct
- 2518 Balaji Ct
- 2523 Balaji Ct
- 2514 Balaji Ct
- 2525 Newpoint Dr
- 2523 Newpoint Dr
- 2519 Balaji Ct
- 16418 Newpoint Ct
- 2519 Newpoint Dr
- 2515 Balaji Ct
- 2510 Balaji Ct
- 2517 Newpoint Dr
- 16412 Newpoint Dr
- 2511 Balaji Ct
- 16412 Newpoint Ct
- 16406 Newpoint Ct
- 16401 Baja Ct
- 2520 Shiva Ct