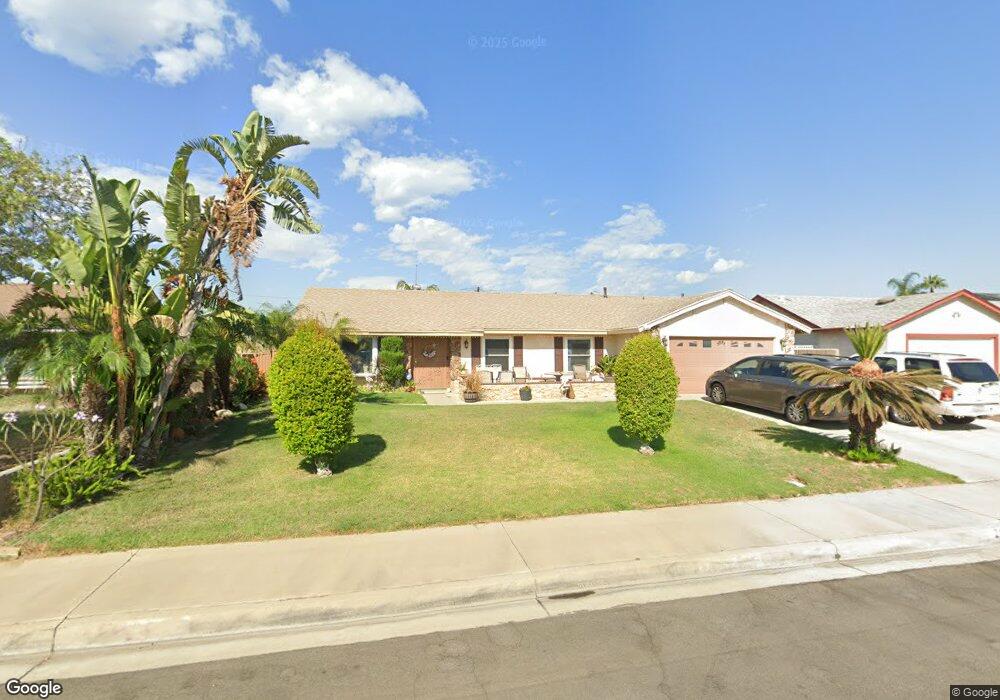
2526 S Goldcrest Place Ontario, CA 91761
Downtown Ontario NeighborhoodEstimated Value: $734,753 - $745,000
4
Beds
2
Baths
1,580
Sq Ft
$467/Sq Ft
Est. Value
About This Home
This home is located at 2526 S Goldcrest Place, Ontario, CA 91761 and is currently estimated at $737,938, approximately $467 per square foot. 2526 S Goldcrest Place is a home located in San Bernardino County with nearby schools including Bon View Elementary, De Anza Middle, and Ontario High School.
Ownership History
Date
Name
Owned For
Owner Type
Purchase Details
Closed on
Aug 20, 2025
Sold by
Taylor Mauvolyene and Taylor-Howard Mauvolyene
Bought by
Mauvolyene Taylor-Howard 2025 Separate Proper and Taylor-Howard
Current Estimated Value
Purchase Details
Closed on
May 21, 2025
Sold by
Howard Perry
Bought by
Taylor Mauvolyene
Purchase Details
Closed on
Aug 11, 2015
Sold by
Taylor Mauvolyene
Bought by
Howard Perry and Taylor Mauvolyene
Purchase Details
Closed on
Apr 13, 2006
Sold by
Taylor Paul
Bought by
Taylor Mauvolyene
Home Financials for this Owner
Home Financials are based on the most recent Mortgage that was taken out on this home.
Original Mortgage
$417,600
Interest Rate
6.35%
Mortgage Type
New Conventional
Purchase Details
Closed on
Feb 6, 2001
Sold by
Taylor Mauvolyene
Bought by
Taylor Paul and Taylor Mauvolyene
Home Financials for this Owner
Home Financials are based on the most recent Mortgage that was taken out on this home.
Original Mortgage
$156,157
Interest Rate
7.08%
Mortgage Type
FHA
Purchase Details
Closed on
Dec 3, 1999
Sold by
Hud
Bought by
Taylor Mauvolyene
Home Financials for this Owner
Home Financials are based on the most recent Mortgage that was taken out on this home.
Original Mortgage
$138,176
Interest Rate
7.96%
Mortgage Type
FHA
Purchase Details
Closed on
Dec 2, 1999
Sold by
Taylor Paul
Bought by
Taylor Mauvolyene C
Home Financials for this Owner
Home Financials are based on the most recent Mortgage that was taken out on this home.
Original Mortgage
$138,176
Interest Rate
7.96%
Mortgage Type
FHA
Purchase Details
Closed on
Oct 4, 1999
Sold by
Homeside Lending Inc
Bought by
Hud
Home Financials for this Owner
Home Financials are based on the most recent Mortgage that was taken out on this home.
Original Mortgage
$138,176
Interest Rate
7.96%
Mortgage Type
FHA
Purchase Details
Closed on
Aug 6, 1999
Sold by
Blancarte Jesus J
Bought by
Homeside Lending Inc
Purchase Details
Closed on
Jul 3, 1997
Sold by
Ocwen Federal Bank Fsb
Bought by
Blancarte Jesus J and Blancarte Sandra L
Home Financials for this Owner
Home Financials are based on the most recent Mortgage that was taken out on this home.
Original Mortgage
$126,957
Interest Rate
7.83%
Mortgage Type
FHA
Purchase Details
Closed on
Feb 12, 1997
Sold by
Madrigal Victor
Bought by
Ocwen Federal Bank Fsb
Purchase Details
Closed on
Oct 2, 1996
Sold by
Madrigal Victor
Bought by
Great Western Bank Fsb
Purchase Details
Closed on
May 18, 1995
Sold by
Madrigal Ana
Bought by
Aguirre Rosa and Aguirre Marco A
Create a Home Valuation Report for This Property
The Home Valuation Report is an in-depth analysis detailing your home's value as well as a comparison with similar homes in the area
Home Values in the Area
Average Home Value in this Area
Purchase History
| Date | Buyer | Sale Price | Title Company |
|---|---|---|---|
| Mauvolyene Taylor-Howard 2025 Separate Proper | -- | None Listed On Document | |
| Taylor Mauvolyene | -- | None Listed On Document | |
| Howard Perry | -- | Accommodation | |
| Taylor Mauvolyene | -- | Chicago Title Co | |
| Taylor Paul | -- | United Title Company | |
| Taylor Mauvolyene | $143,500 | Commonwealth Land Title Co | |
| Taylor Mauvolyene C | -- | Commonwealth Land Title Co | |
| Hud | $138,730 | Fidelity National Title Ins | |
| Homeside Lending Inc | $138,730 | Fidelity National Title Ins | |
| Blancarte Jesus J | $128,000 | Fidelity National Title | |
| Ocwen Federal Bank Fsb | $101,361 | Chicago Title Co | |
| Great Western Bank Fsb | $92,750 | Chicago Title Co | |
| Aguirre Rosa | -- | -- |
Source: Public Records
Mortgage History
| Date | Status | Borrower | Loan Amount |
|---|---|---|---|
| Previous Owner | Taylor Mauvolyene | $417,600 | |
| Previous Owner | Taylor Paul | $156,157 | |
| Previous Owner | Taylor Mauvolyene | $138,176 | |
| Previous Owner | Blancarte Jesus J | $126,957 |
Source: Public Records
Tax History Compared to Growth
Tax History
| Year | Tax Paid | Tax Assessment Tax Assessment Total Assessment is a certain percentage of the fair market value that is determined by local assessors to be the total taxable value of land and additions on the property. | Land | Improvement |
|---|---|---|---|---|
| 2025 | $2,348 | $219,947 | $76,850 | $143,097 |
| 2024 | $2,348 | $215,634 | $75,343 | $140,291 |
| 2023 | $2,282 | $211,406 | $73,866 | $137,540 |
| 2022 | $2,251 | $207,261 | $72,418 | $134,843 |
| 2021 | $2,236 | $203,197 | $70,998 | $132,199 |
| 2020 | $2,197 | $201,113 | $70,270 | $130,843 |
| 2019 | $2,177 | $197,169 | $68,892 | $128,277 |
| 2018 | $2,147 | $193,303 | $67,541 | $125,762 |
| 2017 | $2,070 | $189,513 | $66,217 | $123,296 |
| 2016 | $5,838 | $185,797 | $64,919 | $120,878 |
| 2015 | $4,009 | $183,006 | $63,944 | $119,062 |
| 2014 | $1,915 | $179,421 | $62,691 | $116,730 |
Source: Public Records
Map
Nearby Homes
- 2408 S Taylor Place
- 2437 S Garfield Place
- 4235 S Gasly Paseo
- 0 Vineyard Unit CV25067044
- 4245 S Grasly Paseo
- 4233 S Grasly Paseo
- 0 Phillips Unit CV23180894
- 1020 E Tam o Shanter Ct
- 2453 S Marigold Place
- 513 E Fairfield Ct
- 2119 S Phoenix Place
- 2708 S Parkside Dr
- 2300 S Sultana Ave Unit 298
- 2919 S Caldwell Ave
- 2030 S Bon View Ave Unit G
- 840 E Cedar St
- 2001 S Campus Ave Unit 7F
- 2148 S Sultana Ave
- 310 E Philadelphia St Unit 35
- 310 E Philadelphia St
- 2520 S Goldcrest Place
- 2532 S Goldcrest Place
- 2521 S Bon View Ave
- 2515 S Bon View Ave
- 2527 S Bon View Ave
- 2538 S Goldcrest Place
- 2527 S Goldcrest Place
- 2515 S Goldcrest Place
- 2533 S Bon View Ave
- 2533 S Goldcrest Place
- 2544 S Goldcrest Place
- 915 E Banyan St
- 909 E Banyan St
- 921 E Banyan St
- 2539 S Bon View Ave
- 903 E Banyan St
- 927 E Banyan St
- 2526 S Greenwood Place
- 2526 S Bon View Ave
- 2520 S Greenwood Place