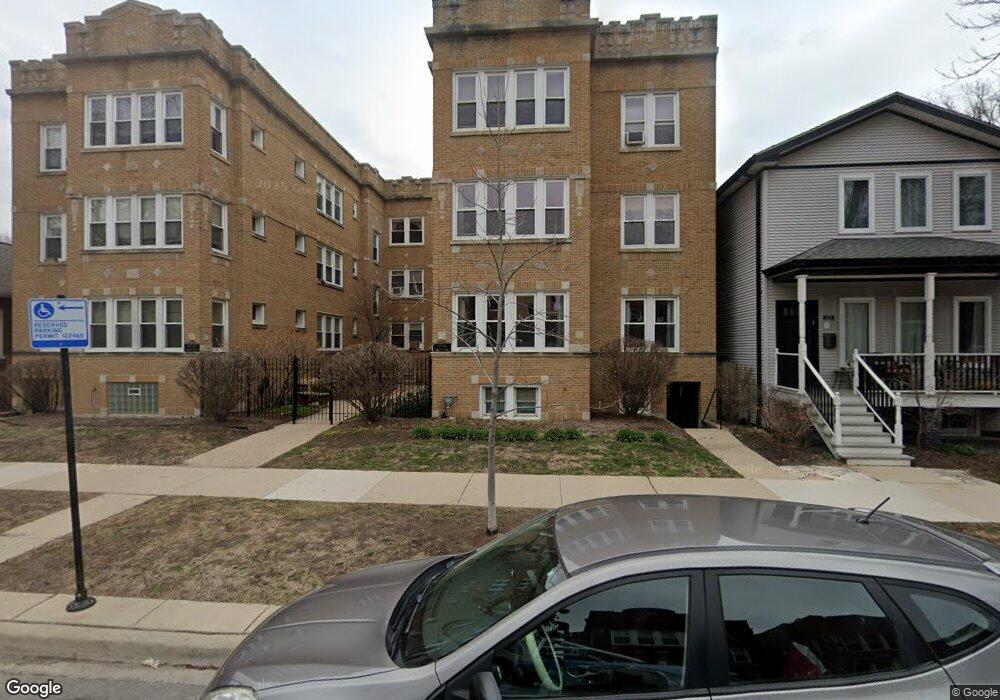
2526 W Argyle St Unit 25323 Chicago, IL 60625
Lincoln Square NeighborhoodEstimated Value: $254,992 - $781,000
1
Bed
1
Bath
907
Sq Ft
$440/Sq Ft
Est. Value
About This Home
This home is located at 2526 W Argyle St Unit 25323, Chicago, IL 60625 and is currently estimated at $398,748, approximately $439 per square foot. 2526 W Argyle St Unit 25323 is a home located in Cook County with nearby schools including Budlong Elementary School, Amundsen High School, and St. Matthias School.
Ownership History
Date
Name
Owned For
Owner Type
Purchase Details
Closed on
Jun 20, 2016
Sold by
Trongale Nicholas A and Trongale Elizabeth M
Bought by
Martinicky Miranda J
Current Estimated Value
Home Financials for this Owner
Home Financials are based on the most recent Mortgage that was taken out on this home.
Original Mortgage
$112,500
Interest Rate
3.75%
Mortgage Type
New Conventional
Purchase Details
Closed on
Jul 26, 2012
Sold by
Trongale Elizabeth M and Trongale Nicholas A
Bought by
Trongale Nicholas A and Trongale Elizabeth M
Purchase Details
Closed on
Jan 5, 2004
Sold by
Mogab Jonna
Bought by
Oldroyd Elizabeth M
Home Financials for this Owner
Home Financials are based on the most recent Mortgage that was taken out on this home.
Original Mortgage
$130,000
Interest Rate
5.91%
Mortgage Type
Purchase Money Mortgage
Create a Home Valuation Report for This Property
The Home Valuation Report is an in-depth analysis detailing your home's value as well as a comparison with similar homes in the area
Home Values in the Area
Average Home Value in this Area
Purchase History
| Date | Buyer | Sale Price | Title Company |
|---|---|---|---|
| Martinicky Miranda J | $162,500 | None Available | |
| Trongale Nicholas A | -- | None Available | |
| Oldroyd Elizabeth M | $175,000 | Chicago Title Insurance Comp |
Source: Public Records
Mortgage History
| Date | Status | Borrower | Loan Amount |
|---|---|---|---|
| Previous Owner | Martinicky Miranda J | $112,500 | |
| Previous Owner | Oldroyd Elizabeth M | $130,000 |
Source: Public Records
Tax History Compared to Growth
Tax History
| Year | Tax Paid | Tax Assessment Tax Assessment Total Assessment is a certain percentage of the fair market value that is determined by local assessors to be the total taxable value of land and additions on the property. | Land | Improvement |
|---|---|---|---|---|
| 2024 | $3,520 | $20,498 | $2,478 | $18,020 |
| 2023 | $3,410 | $20,000 | $1,675 | $18,325 |
| 2022 | $3,410 | $20,000 | $1,675 | $18,325 |
| 2021 | $3,352 | $19,999 | $1,675 | $18,324 |
| 2020 | $2,675 | $15,112 | $1,675 | $13,437 |
| 2019 | $3,350 | $16,672 | $1,675 | $14,997 |
| 2018 | $3,293 | $16,672 | $1,675 | $14,997 |
| 2017 | $3,951 | $18,355 | $1,465 | $16,890 |
| 2016 | $3,176 | $18,355 | $1,465 | $16,890 |
| 2015 | $3,426 | $21,320 | $1,465 | $19,855 |
| 2014 | $2,511 | $16,104 | $1,361 | $14,743 |
| 2013 | $2,451 | $16,104 | $1,361 | $14,743 |
Source: Public Records
Map
Nearby Homes
- 2527 W Argyle St
- 2522 W Winnemac Ave
- 2524 W Winnemac Ave
- 4950 N Western Ave Unit 5H
- 5061 N Lincoln Ave Unit 201
- 2505 W Carmen Ave Unit 303
- 2401 W Winnemac Ave Unit 4W
- 4850 N Rockwell St
- 5011 N Western Ave
- 2607 W Carmen Ave
- 5058 N Claremont Ave Unit 2E
- 4751 N Artesian Ave Unit 205
- 4751 N Artesian Ave Unit 409
- 2426 W Winona St
- 2461 W Foster Ave Unit 2E
- 2457 W Foster Ave Unit 1
- 2463 W Foster Ave Unit 3
- 2352 W Winona St Unit 3E
- 2601 W Foster Ave Unit 3S
- 2720 W Gunnison St
- 2526 W Argyle St Unit 25281
- 2526 W Argyle St Unit 25263
- 2526 W Argyle St Unit 25261
- 2526 W Argyle St Unit 25302
- 2526 W Argyle St Unit 25262
- 2526 W Argyle St Unit 25301
- 2526 W Argyle St Unit 25322
- 2526 W Argyle St Unit 25282
- 2526 W Argyle St Unit P2
- 2526 W Argyle St Unit P1
- 2526 W Argyle St Unit 2
- 2526 W Argyle St Unit 1
- 2532 W Argyle St Unit P4
- 2530 W Argyle St Unit 25303
- 2528 W Argyle St Unit 25283
- 2532 W Argyle St Unit 25321
- 2530 W Argyle St Unit P3
- 2530 W Argyle St Unit 3
- 2532 W Argyle St Unit 3
- 2532 W Argyle St Unit 2