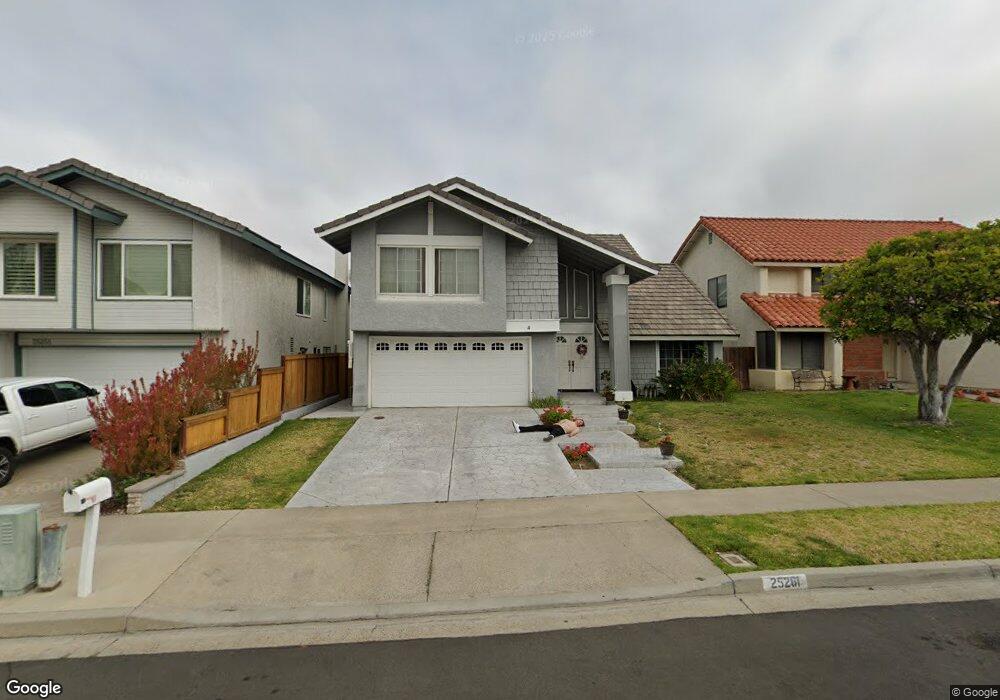
25261 Ginger Rd Lake Forest, CA 92630
Estimated Value: $1,270,000 - $1,334,798
4
Beds
3
Baths
2,474
Sq Ft
$526/Sq Ft
Est. Value
About This Home
This home is located at 25261 Ginger Rd, Lake Forest, CA 92630 and is currently estimated at $1,300,950, approximately $525 per square foot. 25261 Ginger Rd is a home located in Orange County with nearby schools including La Madera Elementary School, Serrano Intermediate School, and El Toro High School.
Ownership History
Date
Name
Owned For
Owner Type
Purchase Details
Closed on
Jul 2, 2025
Sold by
Claycomb John W and Claycomb Denise Masunas
Bought by
Masunas Claycomb Family Trust and Claycomb
Current Estimated Value
Purchase Details
Closed on
Nov 19, 2001
Sold by
Claycomb John W
Bought by
Claycomb John W and Claycomb Denise Masunas
Home Financials for this Owner
Home Financials are based on the most recent Mortgage that was taken out on this home.
Original Mortgage
$137,000
Interest Rate
6.57%
Purchase Details
Closed on
Jan 31, 1995
Sold by
Citibank N A
Bought by
Claycomb John W
Home Financials for this Owner
Home Financials are based on the most recent Mortgage that was taken out on this home.
Original Mortgage
$150,000
Interest Rate
9.2%
Purchase Details
Closed on
Nov 10, 1994
Sold by
Citibank
Bought by
Citibank
Create a Home Valuation Report for This Property
The Home Valuation Report is an in-depth analysis detailing your home's value as well as a comparison with similar homes in the area
Home Values in the Area
Average Home Value in this Area
Purchase History
We collect this data history from publicly available records. To have your information removed, we recommend requesting removal directly through your county’s website.
| Date | Buyer | Sale Price | Title Company |
|---|---|---|---|
| Masunas Claycomb Family Trust | -- | None Listed On Document | |
| Claycomb John W | -- | California Counties Title Co | |
| Claycomb John W | $225,000 | Gateway Title Company | |
| Citibank | $250,000 | First Southwestern Title |
Source: Public Records
Mortgage History
We collect this data history from publicly available records. To have your information removed, we recommend requesting removal directly through your county’s website.
| Date | Status | Borrower | Loan Amount |
|---|---|---|---|
| Previous Owner | Claycomb John W | $137,000 | |
| Previous Owner | Claycomb John W | $150,000 |
Source: Public Records
Tax History
| Year | Tax Paid | Tax Assessment Tax Assessment Total Assessment is a certain percentage of the fair market value that is determined by local assessors to be the total taxable value of land and additions on the property. | Land | Improvement |
|---|---|---|---|---|
| 2025 | $3,800 | $377,918 | $154,287 | $223,631 |
| 2024 | $3,800 | $370,508 | $151,261 | $219,247 |
| 2023 | $3,710 | $363,244 | $148,295 | $214,949 |
| 2022 | $3,642 | $356,122 | $145,387 | $210,735 |
| 2021 | $3,568 | $349,140 | $142,537 | $206,603 |
| 2020 | $3,536 | $345,560 | $141,075 | $204,485 |
| 2019 | $3,464 | $338,785 | $138,309 | $200,476 |
| 2018 | $3,398 | $332,143 | $135,597 | $196,546 |
| 2017 | $3,329 | $325,631 | $132,938 | $192,693 |
| 2016 | $3,273 | $319,247 | $130,332 | $188,915 |
| 2015 | $3,232 | $314,452 | $128,374 | $186,078 |
| 2014 | $3,160 | $308,293 | $125,860 | $182,433 |
Source: Public Records
Map
Nearby Homes
- 22061 Comanche Rd
- 25061 Shaver Lake Cir
- 22246 Lantern Ln
- 25132 Vista Serrano
- 24836 Lakefield St
- 21632 Treeline Ln
- 22045 Lakeland Ave
- 22342 Blueberry Ln
- 25502 Sawmill Ln
- 21476 Cypresswood
- 24946 Ravenswood
- 21466 Cypresswood
- 25652 Rimgate Dr Unit 6C
- 25392 Elderwood
- 25631 Mont Pointe Unit 7D
- 25594 Mont Pointe Unit 4A
- 21621 Canada Rd
- 25614 Mont Pointe Unit 3D
- 24881 Rollingwood Rd
- 21732 Exton Way
- 25275 Ginger Rd
- 25271 Ginger Rd
- 25281 Ginger Rd
- 25291 Ginger Rd
- 25252 Cinnamon Rd
- 25242 Cinnamon Rd
- 25256 Cinnamon Rd
- 25236 Cinnamon Rd
- 25262 Cinnamon Rd
- 25251 Ginger Rd
- 25301 Ginger Rd
- 25276 Ginger Rd
- 25272 Ginger Rd
- 25282 Ginger Rd
- 25226 Cinnamon Rd
- 25272 Cinnamon Rd
- 25262 Ginger Rd
- 25292 Ginger Rd
- 25241 Ginger Rd
- 25311 Ginger Rd
Your Personal Tour Guide
Ask me questions while you tour the home.