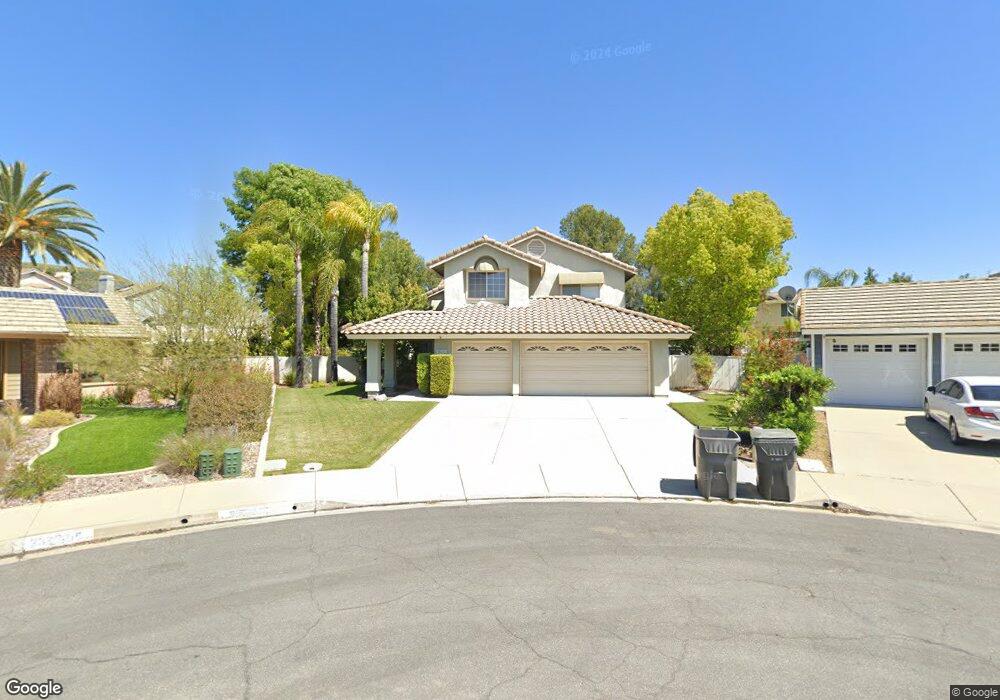
25262 Corte Sandia Murrieta, CA 92563
Alta Murrieta NeighborhoodEstimated Value: $698,000 - $809,000
5
Beds
3
Baths
2,538
Sq Ft
$297/Sq Ft
Est. Value
About This Home
This home is located at 25262 Corte Sandia, Murrieta, CA 92563 and is currently estimated at $753,083, approximately $296 per square foot. 25262 Corte Sandia is a home located in Riverside County with nearby schools including Rail Ranch Elementary School, Shivela Middle School, and Vista Murrieta High School.
Ownership History
Date
Name
Owned For
Owner Type
Purchase Details
Closed on
May 13, 2016
Sold by
Clark Robert W
Bought by
Clark Robin T
Current Estimated Value
Home Financials for this Owner
Home Financials are based on the most recent Mortgage that was taken out on this home.
Original Mortgage
$300,000
Outstanding Balance
$238,118
Interest Rate
3.57%
Mortgage Type
New Conventional
Estimated Equity
$514,965
Purchase Details
Closed on
Apr 12, 2001
Sold by
Washington Mutual Bank Fa
Bought by
Clark Robert W and Clark Robin T
Home Financials for this Owner
Home Financials are based on the most recent Mortgage that was taken out on this home.
Original Mortgage
$194,800
Interest Rate
6.89%
Mortgage Type
Purchase Money Mortgage
Purchase Details
Closed on
Nov 21, 2000
Sold by
Fontenot John R and Fontenot Caryn A
Bought by
Bank United
Create a Home Valuation Report for This Property
The Home Valuation Report is an in-depth analysis detailing your home's value as well as a comparison with similar homes in the area
Home Values in the Area
Average Home Value in this Area
Purchase History
| Date | Buyer | Sale Price | Title Company |
|---|---|---|---|
| Clark Robin T | -- | Chicago Title Company | |
| Clark Robert W | $243,500 | Fidelity National Title Co | |
| Bank United | $220,000 | Fidelity Title |
Source: Public Records
Mortgage History
| Date | Status | Borrower | Loan Amount |
|---|---|---|---|
| Open | Clark Robin T | $300,000 | |
| Closed | Clark Robert W | $194,800 |
Source: Public Records
Tax History Compared to Growth
Tax History
| Year | Tax Paid | Tax Assessment Tax Assessment Total Assessment is a certain percentage of the fair market value that is determined by local assessors to be the total taxable value of land and additions on the property. | Land | Improvement |
|---|---|---|---|---|
| 2025 | $4,476 | $399,992 | $97,928 | $302,064 |
| 2023 | $4,476 | $384,462 | $94,126 | $290,336 |
| 2022 | $4,457 | $376,925 | $92,281 | $284,644 |
| 2021 | $4,375 | $369,535 | $90,472 | $279,063 |
| 2020 | $4,332 | $365,747 | $89,545 | $276,202 |
| 2019 | $4,250 | $358,577 | $87,790 | $270,787 |
| 2018 | $4,170 | $351,547 | $86,069 | $265,478 |
| 2017 | $4,113 | $344,655 | $84,382 | $260,273 |
| 2016 | $4,059 | $337,898 | $82,728 | $255,170 |
| 2015 | $4,016 | $332,825 | $81,487 | $251,338 |
| 2014 | $3,833 | $326,307 | $79,892 | $246,415 |
Source: Public Records
Map
Nearby Homes
- 40080 Avenida Palizada
- 39270 Corte Pluma
- 39317 Via Sonrisa
- 25134 Calle Entradero
- 25187 Corte Sombrero
- 39587 Calle Casablanca
- 39712 Corte Santa Barbara
- 39201 Dovetree Dr
- 25148 Corte Anacapa
- 25382 Blackthorne Dr
- 25269 Corte Mandarina
- 25099 Calle Entradero
- 39785 Via Careza
- 25444 Clover Glen Cir
- 39861 Via Castana
- 37790 Los Alamos Rd
- 39938 Pearl Dr
- 24809 Sweetgrass Ct
- 39058 Camino Hermosa
- 25552 Blackwood Rd
- 25250 Corte Sandia
- 25261 Corte Sandia
- 25226 Corte Sandia
- 39821 Avenida Palizada
- 25249 Corte Sandia
- 25239 Via Pera
- 25235 Via Pera
- 39809 Avenida Palizada
- 25225 Corte Sandia
- 25247 Via Pera
- 25222 Corte Sandia
- 39853 Avenida Palizada
- 25227 Via Pera
- 25221 Corte Sandia
- 25251 Via Pera
- 39869 Avenida Palizada
- 25214 Corte Sandia
- 39771 Avenida Palizada
- 25213 Corte Sandia
- 25219 Via Pera