Estimated Value: $350,738 - $683,000
4
Beds
3
Baths
3,223
Sq Ft
$158/Sq Ft
Est. Value
About This Home
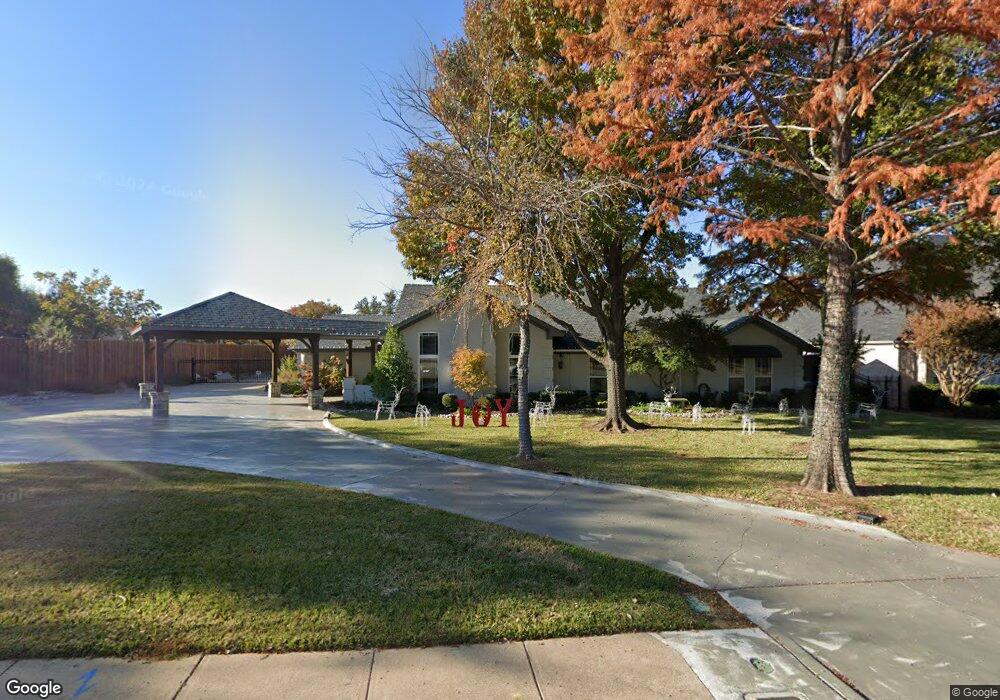
This home is located at 2529 Norwood Dr, Hurst, TX 76054 and is currently estimated at $509,685, approximately $158 per square foot. 2529 Norwood Dr is a home located in Tarrant County with nearby schools including Walker Creek Elementary School, Smithfield Middle School, and Birdville High School.
Ownership History
Date
Name
Owned For
Owner Type
Purchase Details
Closed on
Dec 14, 2022
Sold by
Cwt Construction
Bought by
Sharkawy Malak
Current Estimated Value
Purchase Details
Closed on
Nov 19, 2018
Sold by
Griggs Jenny
Bought by
Maciel Lunsford Construction Llc
Purchase Details
Closed on
May 8, 2017
Sold by
Frezza Frezza G and Frezza Grace Miechel
Bought by
Lunsford Denise B and Lunsford Brian D
Home Financials for this Owner
Home Financials are based on the most recent Mortgage that was taken out on this home.
Original Mortgage
$415,000
Interest Rate
4.14%
Mortgage Type
Commercial
Purchase Details
Closed on
Jan 6, 1998
Sold by
Sztamenits Gabor
Bought by
Frezza G Miechel
Home Financials for this Owner
Home Financials are based on the most recent Mortgage that was taken out on this home.
Original Mortgage
$172,000
Interest Rate
7.13%
Create a Home Valuation Report for This Property
The Home Valuation Report is an in-depth analysis detailing your home's value as well as a comparison with similar homes in the area
Home Values in the Area
Average Home Value in this Area
Purchase History
| Date | Buyer | Sale Price | Title Company |
|---|---|---|---|
| Sharkawy Malak | -- | Providence Title Company | |
| Maciel Lunsford Construction Llc | -- | None Available | |
| Lunsford Denise B | -- | None Available | |
| Frezza G Miechel | -- | American Title Co |
Source: Public Records
Mortgage History
| Date | Status | Borrower | Loan Amount |
|---|---|---|---|
| Previous Owner | Lunsford Denise B | $415,000 | |
| Previous Owner | Frezza G Miechel | $172,000 |
Source: Public Records
Tax History Compared to Growth
Tax History
| Year | Tax Paid | Tax Assessment Tax Assessment Total Assessment is a certain percentage of the fair market value that is determined by local assessors to be the total taxable value of land and additions on the property. | Land | Improvement |
|---|---|---|---|---|
| 2025 | $6,876 | $615,541 | $161,235 | $454,306 |
| 2024 | $6,876 | $615,541 | $161,235 | $454,306 |
| 2023 | $11,821 | $619,077 | $161,235 | $457,842 |
| 2022 | $11,626 | $506,434 | $90,000 | $416,434 |
| 2021 | $11,089 | $427,478 | $90,000 | $337,478 |
| 2020 | $10,257 | $399,151 | $90,000 | $309,151 |
| 2019 | $11,782 | $448,264 | $90,000 | $358,264 |
| 2018 | $9,273 | $409,261 | $90,000 | $319,261 |
| 2017 | $10,084 | $401,245 | $30,000 | $371,245 |
| 2016 | $9,167 | $358,803 | $30,000 | $328,803 |
| 2015 | $7,783 | $312,300 | $30,000 | $282,300 |
| 2014 | $7,783 | $312,300 | $30,000 | $282,300 |
Source: Public Records
Map
Nearby Homes
- 2668 Bent Tree Dr
- 2244 Hurstview Dr
- 2620 Brookridge Dr
- 404 Heather Ln
- 712 Springwood Dr
- 2212 Hurstview Dr
- 3713 Brentwood Ct
- 2732 Woodbridge Dr
- 2804 Ridgewood Dr
- 712 Springhill Dr
- 736 Springhill Dr
- 2908 Steve Dr
- 6521 Rock Springs Dr
- 2844 Hurstview Dr
- 2809 Sandstone Dr
- 421 Cavender Ct
- 2829 Sandstone Dr
- 305 Warbler Dr
- 6505 Parkway Ave
- 6801 Woodland Hills Dr
- 2531 Norwood Dr
- 2513 Hurstview Dr
- 2509 Hurstview Dr
- 512 Lynndale Ct
- 513 Lynndale Ct
- 2505 Hurstview Dr
- 2513 Norwood Dr
- 2508 Hurstview Dr
- 429 Lynndale Ct
- 2504 Hurstview Dr
- 2520 Norwood Dr
- 2501 Hurstview Dr
- 428 Lynn Dale Ct
- 2500 Hurstview Dr
- 428 Lynndale Ct
- 425 Lynndale Ct
- 2505 Norwood Dr
- 600 Cumberland Dr
- 520 Cumberland Dr
- 604 Cumberland Dr