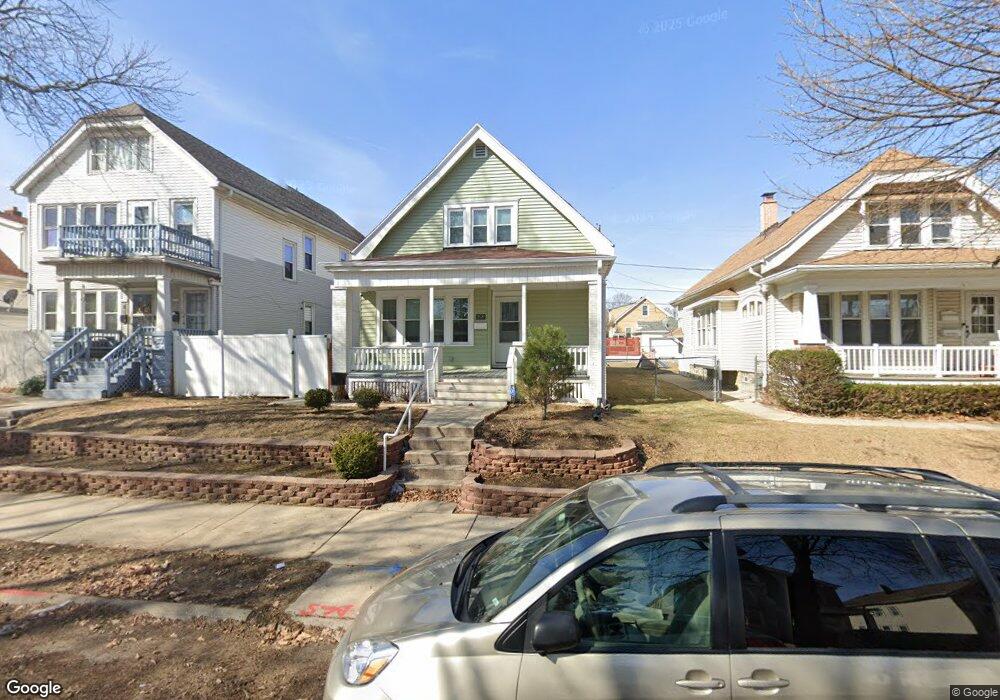
2529 S 19th St Milwaukee, WI 53215
Forest Home Hills NeighborhoodEstimated Value: $200,000 - $254,000
4
Beds
3
Baths
1,806
Sq Ft
$122/Sq Ft
Est. Value
About This Home
This home is located at 2529 S 19th St, Milwaukee, WI 53215 and is currently estimated at $220,134, approximately $121 per square foot. 2529 S 19th St is a home located in Milwaukee County with nearby schools including Milwaukee Spanish Immersion School - Upper Campus, La Escuela Fratney, and Milwaukee German Immersion School.
Ownership History
Date
Name
Owned For
Owner Type
Purchase Details
Closed on
Jan 10, 2018
Sold by
Torre Juan De Le and Tapia Cruz Bertha A
Bought by
Ramirez Escoto Ana Ramirez and Ramirez Escoto Juana Gabriela
Current Estimated Value
Home Financials for this Owner
Home Financials are based on the most recent Mortgage that was taken out on this home.
Original Mortgage
$117,826
Outstanding Balance
$99,406
Interest Rate
3.93%
Mortgage Type
FHA
Estimated Equity
$120,728
Purchase Details
Closed on
Jul 29, 2010
Sold by
Page Sharon A and Sokolowski Steven J
Bought by
Dele Torre Juan and Tapia Cruz Bertha A
Home Financials for this Owner
Home Financials are based on the most recent Mortgage that was taken out on this home.
Original Mortgage
$43,650
Interest Rate
4.54%
Mortgage Type
New Conventional
Purchase Details
Closed on
Oct 21, 2009
Sold by
Benson Arlene C
Bought by
Page Sharon A and Carter Susan K
Create a Home Valuation Report for This Property
The Home Valuation Report is an in-depth analysis detailing your home's value as well as a comparison with similar homes in the area
Home Values in the Area
Average Home Value in this Area
Purchase History
| Date | Buyer | Sale Price | Title Company |
|---|---|---|---|
| Ramirez Escoto Ana Ramirez | $120,000 | None Available | |
| Dele Torre Juan | $45,000 | None Available | |
| Page Sharon A | -- | None Available |
Source: Public Records
Mortgage History
| Date | Status | Borrower | Loan Amount |
|---|---|---|---|
| Open | Ramirez Escoto Ana Ramirez | $117,826 | |
| Previous Owner | Dele Torre Juan | $43,650 |
Source: Public Records
Tax History Compared to Growth
Tax History
| Year | Tax Paid | Tax Assessment Tax Assessment Total Assessment is a certain percentage of the fair market value that is determined by local assessors to be the total taxable value of land and additions on the property. | Land | Improvement |
|---|---|---|---|---|
| 2024 | $3,501 | $156,500 | $8,100 | $148,400 |
| 2023 | $3,077 | $130,200 | $8,100 | $122,100 |
| 2022 | $3,027 | $130,200 | $8,100 | $122,100 |
| 2021 | $2,689 | $105,000 | $8,100 | $96,900 |
| 2020 | $2,718 | $105,000 | $8,100 | $96,900 |
| 2019 | $2,325 | $85,800 | $8,200 | $77,600 |
| 2018 | $2,153 | $85,800 | $8,200 | $77,600 |
| 2017 | $2,116 | $80,200 | $6,800 | $73,400 |
| 2016 | $2,209 | $79,600 | $6,800 | $72,800 |
| 2015 | $2,256 | $79,600 | $6,800 | $72,800 |
| 2014 | $2,198 | $76,000 | $6,800 | $69,200 |
| 2013 | -- | $76,000 | $6,800 | $69,200 |
Source: Public Records
Map
Nearby Homes
- 2364 S 20th St
- 2370 S 18th St
- 2708 S 20th St
- 2323 S 17th St
- 2354 S 16th St
- 2535 S 15th St
- 2036 W Lincoln Ave
- 2225 S 17th St
- 2221 S 21st St Unit 2223
- 2201 S 20th St
- 2172 S 18th St
- 2449 S 13th St
- 2424 S 13th St
- 2674 S 13th St
- 1835 W Becher St
- 2411 S 12th St
- 2007 W Forest Home Ave
- 2045 W Becher St
- 2220 S 14th St
- 2604 W Lincoln Ave
- 2525 S 19th St
- 2533 S 19th St Unit 2535
- 2551A S 19th St
- 2519 S 19th St
- 2539 S 19th St
- 2513 S 19th St
- 2545 S 19th St
- 2528 S 20th St
- 2522 S 20th St
- 2534A S 20th St
- 2538 S 20th St
- 2518 S 20th St
- 2507 S 19th St Unit 2509
- 2534 S 20th St Unit 2534A
- 2544 S 20th St
- 2528 S 19th St Unit 2530
- 2524 S 19th St Unit 2526
- 2512 S 20th St
- 2534 S 19th St
- 2518 S 19th St Unit 2520