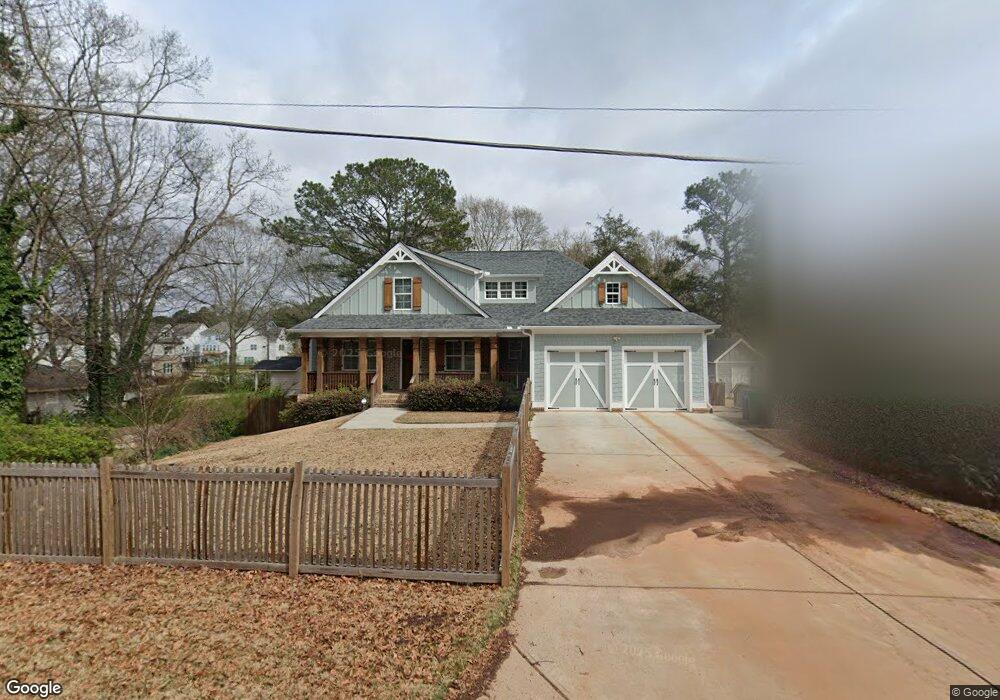
2529 Saint Charles Dr SE Smyrna, GA 30080
Estimated Value: $604,096 - $867,000
4
Beds
3
Baths
2,370
Sq Ft
$291/Sq Ft
Est. Value
About This Home
This home is located at 2529 Saint Charles Dr SE, Smyrna, GA 30080 and is currently estimated at $689,524, approximately $290 per square foot. 2529 Saint Charles Dr SE is a home located in Cobb County with nearby schools including Smyrna Elementary School, Campbell Middle School, and Campbell High School.
Ownership History
Date
Name
Owned For
Owner Type
Purchase Details
Closed on
Oct 4, 2024
Sold by
Le Truong T and Le Amanda
Bought by
Truong Tan Le 2024 Trust and Amanda Frances Le 2024 Trust
Current Estimated Value
Purchase Details
Closed on
Sep 15, 2017
Bought by
Le Truong T and Le Truong Amanda
Home Financials for this Owner
Home Financials are based on the most recent Mortgage that was taken out on this home.
Original Mortgage
$415,900
Interest Rate
4.49%
Mortgage Type
New Conventional
Purchase Details
Closed on
Apr 2, 2013
Sold by
Kicklighter Jolaine
Bought by
1411 Hawthorne Llc
Purchase Details
Closed on
Nov 30, 1998
Sold by
Wilson Erma G
Bought by
Kicklighter Jolaine
Home Financials for this Owner
Home Financials are based on the most recent Mortgage that was taken out on this home.
Original Mortgage
$71,166
Interest Rate
6.77%
Mortgage Type
FHA
Create a Home Valuation Report for This Property
The Home Valuation Report is an in-depth analysis detailing your home's value as well as a comparison with similar homes in the area
Home Values in the Area
Average Home Value in this Area
Purchase History
| Date | Buyer | Sale Price | Title Company |
|---|---|---|---|
| Truong Tan Le 2024 Trust | -- | None Listed On Document | |
| Le Truong T | $135,000 | -- | |
| 1411 Hawthorne Llc | $83,600 | -- | |
| 1411 Hawthorne Llc | $83,600 | -- | |
| Kicklighter Jolaine | $71,500 | -- |
Source: Public Records
Mortgage History
| Date | Status | Borrower | Loan Amount |
|---|---|---|---|
| Previous Owner | Le Truong T | $415,900 | |
| Previous Owner | Kicklighter Jolaine | $71,166 |
Source: Public Records
Tax History Compared to Growth
Tax History
| Year | Tax Paid | Tax Assessment Tax Assessment Total Assessment is a certain percentage of the fair market value that is determined by local assessors to be the total taxable value of land and additions on the property. | Land | Improvement |
|---|---|---|---|---|
| 2025 | $6,496 | $283,348 | $46,000 | $237,348 |
| 2024 | $6,280 | $271,784 | $40,000 | $231,784 |
| 2023 | $4,574 | $206,744 | $32,000 | $174,744 |
| 2022 | $4,673 | $184,028 | $18,000 | $166,028 |
| 2021 | $5,224 | $184,028 | $18,000 | $166,028 |
| 2020 | $4,996 | $173,620 | $18,000 | $155,620 |
| 2019 | $4,996 | $173,620 | $18,000 | $155,620 |
| 2018 | $243 | $8,000 | $8,000 | $0 |
| 2017 | $1,255 | $43,660 | $18,000 | $25,660 |
| 2016 | $1,255 | $43,660 | $18,000 | $25,660 |
| 2015 | $917 | $31,112 | $18,000 | $13,112 |
| 2014 | $839 | $28,232 | $0 | $0 |
Source: Public Records
Map
Nearby Homes
- 1461 Hawthorne Ave SE
- 1385 Hawthorne Ave SE
- 1365 Hawthorne Ave SE
- 1436 Belmont Ave SE
- 1451 Belmont Ave SE
- 3001 Hawthorne Place SE
- 1298 Belmont Ave SE
- 2908 Cottesford Way SE
- 1764 Whitfield Parc Cir
- 1761 Whitfield Parc Cir SE
- 1768 Evenstad Way
- 3037 Ferrington Way
- 3061 Devoncroft St
- 1180 Fleming St SE
- 2801 Priestcliff Dr SE
- 1417 Springleaf Cir SE
- 1579 Walker St SE
- 332 Symphony Way
- 0 Saint Charles Dr SE
- 1415 Hawthorne Ave SE
- 1411 Hawthorne Ave SE
- 1410 Pierce Ave SE
- 1422 Pierce Ave SE
- 1419 Hawthorne Ave SE
- 2538 Saint Charles Dr SE
- 2520 Saint Charles Dr SE
- 1409 Hawthorne Ave SE Unit 32
- 1409 Hawthorne Ave SE
- 1432 Pierce Ave SE
- 1405 Hawthorne Ave SE Unit 31
- 1405 Hawthorne Ave SE
- 1423 Hawthorne Ave SE
- 1401 Hawthorne Ave SE Unit 30
- 1401 Hawthorne Ave SE
- 1397 Hawthorne Ave SE
- 1393 Hawthorne Ave SE Unit 28
- 1393 Hawthorne Ave SE
- 1436 Pierce Ave SE