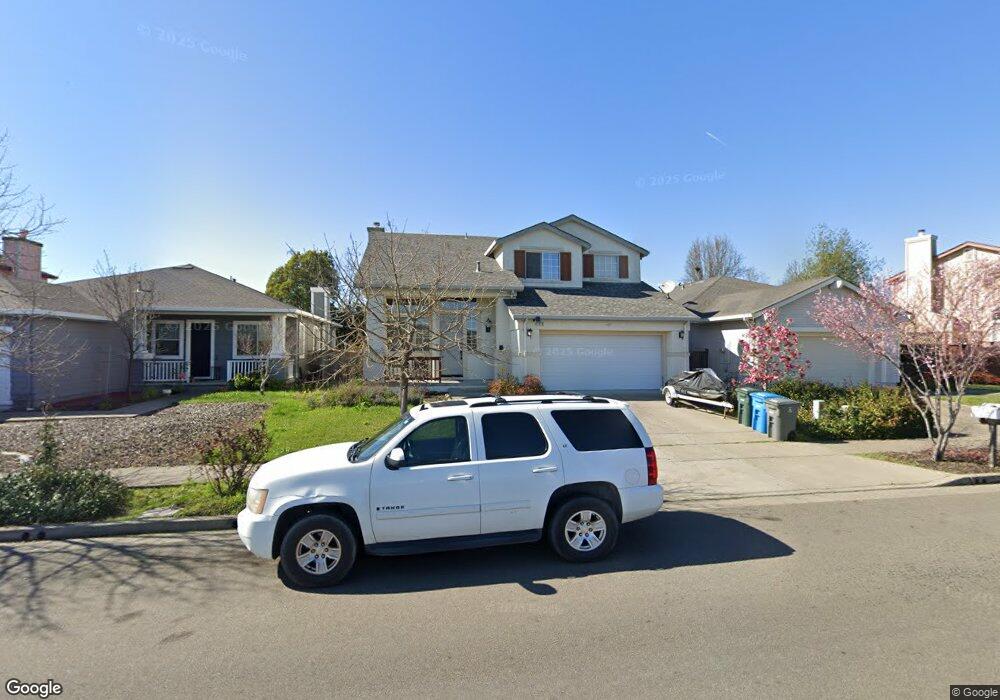
2529 Silver Spur Dr Santa Rosa, CA 95407
Estimated Value: $705,000 - $731,000
4
Beds
3
Baths
2,075
Sq Ft
$345/Sq Ft
Est. Value
About This Home
This home is located at 2529 Silver Spur Dr, Santa Rosa, CA 95407 and is currently estimated at $715,896, approximately $345 per square foot. 2529 Silver Spur Dr is a home located in Sonoma County with nearby schools including Elsie Allen High School and St. Michael's Orthodox School.
Ownership History
Date
Name
Owned For
Owner Type
Purchase Details
Closed on
Jun 9, 2009
Sold by
Sewell Ian and Sewell Wendy
Bought by
Sewell Ian and Sewell Wendy
Current Estimated Value
Home Financials for this Owner
Home Financials are based on the most recent Mortgage that was taken out on this home.
Original Mortgage
$249,500
Outstanding Balance
$157,552
Interest Rate
4.76%
Mortgage Type
New Conventional
Estimated Equity
$558,344
Purchase Details
Closed on
Jul 30, 2001
Sold by
Sewell Ian
Bought by
Sewell Ian and Macfarlane Wendy
Home Financials for this Owner
Home Financials are based on the most recent Mortgage that was taken out on this home.
Original Mortgage
$270,000
Interest Rate
7.1%
Purchase Details
Closed on
Jul 25, 2000
Sold by
Macfarlane Wendy
Bought by
Sewell Ian
Home Financials for this Owner
Home Financials are based on the most recent Mortgage that was taken out on this home.
Original Mortgage
$220,700
Interest Rate
8.2%
Create a Home Valuation Report for This Property
The Home Valuation Report is an in-depth analysis detailing your home's value as well as a comparison with similar homes in the area
Home Values in the Area
Average Home Value in this Area
Purchase History
| Date | Buyer | Sale Price | Title Company |
|---|---|---|---|
| Sewell Ian | -- | Fidelity National Title Co | |
| Sewell Ian | -- | Fidelity National Title Co | |
| Sewell Ian | -- | North American Title Co | |
| Sewell Ian | $276,000 | North American Title Co |
Source: Public Records
Mortgage History
| Date | Status | Borrower | Loan Amount |
|---|---|---|---|
| Open | Sewell Ian | $249,500 | |
| Closed | Sewell Ian | $270,000 | |
| Closed | Sewell Ian | $220,700 | |
| Closed | Sewell Ian | $27,500 |
Source: Public Records
Tax History Compared to Growth
Tax History
| Year | Tax Paid | Tax Assessment Tax Assessment Total Assessment is a certain percentage of the fair market value that is determined by local assessors to be the total taxable value of land and additions on the property. | Land | Improvement |
|---|---|---|---|---|
| 2025 | $4,805 | $415,577 | $113,005 | $302,572 |
| 2024 | $4,805 | $407,430 | $110,790 | $296,640 |
| 2023 | $4,805 | $399,442 | $108,618 | $290,824 |
| 2022 | $4,691 | $391,611 | $106,489 | $285,122 |
| 2021 | $4,641 | $383,933 | $104,401 | $279,532 |
| 2020 | $4,508 | $379,997 | $103,331 | $276,666 |
| 2019 | $4,454 | $372,547 | $101,305 | $271,242 |
| 2018 | $4,418 | $365,243 | $99,319 | $265,924 |
| 2017 | $4,312 | $358,082 | $97,372 | $260,710 |
| 2016 | $4,257 | $351,062 | $95,463 | $255,599 |
| 2015 | $4,122 | $345,790 | $94,030 | $251,760 |
| 2014 | $3,979 | $339,018 | $92,189 | $246,829 |
Source: Public Records
Map
Nearby Homes
- 2632 Wild Bill Way
- 2630 Arrowhead Dr
- 2622 Arrowhead Dr
- 2599 Silver Spur Dr
- 2863 Liscum St
- 1260 Aloise Ave
- 1461 Trombetta St
- 2912 Liscum St
- 2716 Amora Cir
- Plan 2 at Grove Village
- Plan 4 at Grove Village
- Plan 5 at Grove Village
- Plan 1 at Grove Village
- Plan 6 at Grove Village
- 1953 Alamo Ln
- 2931 Liscum St
- 2928 Liscum St
- 2766 Sassy St
- 2778 Sassy St
- 2786 Sassy St
- 2525 Silver Spur Dr
- 2531 Silver Spur Dr
- 2535 Silver Spur Dr
- 2626 Wild Bill Way
- 2521 Silver Spur Dr
- 2628 Wild Bill Way
- 2624 Wild Bill Way
- 2539 Silver Spur Dr
- 2630 Wild Bill Way
- 2517 Silver Spur Dr
- 2622 Wild Bill Way
- 2543 Silver Spur Dr
- 2634 Wild Bill Way
- 2631 Wild Bill Cir
- 2547 Silver Spur Dr
- 1910 Blue Sky Ln
- 2515 Silver Spur Dr
- 2636 Wild Bill Way
- 1903 Blue Sky Ln
- 1907 Blue Sky Ln