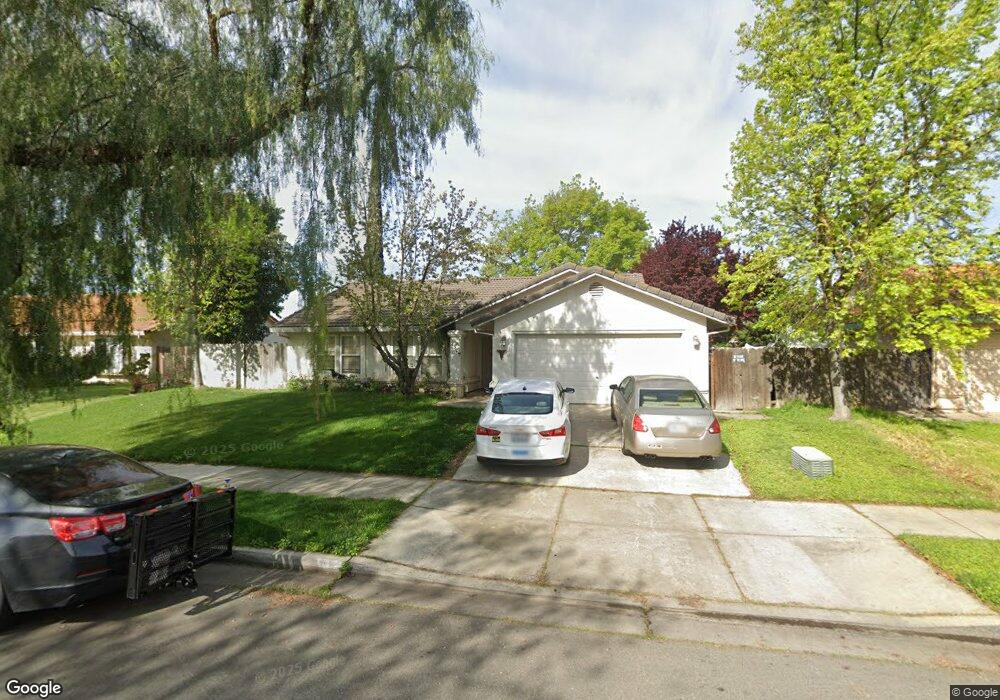
2529 Stonybrook Ave Merced, CA 95348
Estimated Value: $285,000 - $347,162
3
Beds
2
Baths
1,300
Sq Ft
$246/Sq Ft
Est. Value
About This Home
This home is located at 2529 Stonybrook Ave, Merced, CA 95348 and is currently estimated at $320,041, approximately $246 per square foot. 2529 Stonybrook Ave is a home located in Merced County with nearby schools including Luther Burbank Elementary School, Tenaya Middle School, and Merced High School.
Ownership History
Date
Name
Owned For
Owner Type
Purchase Details
Closed on
Aug 1, 2025
Sold by
Stadeer Paula A and Paula A Stadter Trust
Bought by
Guarneros Manuel Alejandro Go and Infante Ma Esveide
Current Estimated Value
Purchase Details
Closed on
Oct 4, 2024
Sold by
Stadter Paula Angelique
Bought by
Paula A Stadter Trust and Stadeer
Purchase Details
Closed on
May 30, 2012
Sold by
Coble Loyd W and Coble Maureen
Bought by
Johnston Ronald James
Purchase Details
Closed on
Sep 26, 2003
Sold by
Jankowski Franca M and Jankowski Paul M
Bought by
Coble Loyd W and Coble Maureen
Home Financials for this Owner
Home Financials are based on the most recent Mortgage that was taken out on this home.
Original Mortgage
$156,000
Interest Rate
5.72%
Mortgage Type
Purchase Money Mortgage
Create a Home Valuation Report for This Property
The Home Valuation Report is an in-depth analysis detailing your home's value as well as a comparison with similar homes in the area
Purchase History
| Date | Buyer | Sale Price | Title Company |
|---|---|---|---|
| Guarneros Manuel Alejandro Go | $280,000 | Transcounty Title Company | |
| Paula A Stadter Trust | -- | None Listed On Document | |
| Johnston Ronald James | $87,500 | None Available | |
| Coble Loyd W | $195,000 | Fidelity Natl Title Co Of Ca |
Source: Public Records
Mortgage History
| Date | Status | Borrower | Loan Amount |
|---|---|---|---|
| Previous Owner | Coble Loyd W | $156,000 | |
| Closed | Coble Loyd W | $14,000 |
Source: Public Records
Tax History
| Year | Tax Paid | Tax Assessment Tax Assessment Total Assessment is a certain percentage of the fair market value that is determined by local assessors to be the total taxable value of land and additions on the property. | Land | Improvement |
|---|---|---|---|---|
| 2025 | $1,242 | $109,892 | $13,810 | $96,082 |
| 2024 | $1,242 | $107,739 | $13,540 | $94,199 |
| 2023 | $1,226 | $105,627 | $13,275 | $92,352 |
| 2022 | $1,279 | $103,557 | $13,015 | $90,542 |
| 2021 | $1,267 | $101,527 | $12,760 | $88,767 |
| 2020 | $1,205 | $100,487 | $12,630 | $87,857 |
| 2019 | $1,192 | $98,518 | $12,383 | $86,135 |
| 2018 | $1,088 | $96,588 | $12,141 | $84,447 |
| 2017 | $1,118 | $94,695 | $11,903 | $82,792 |
| 2016 | $1,101 | $92,839 | $11,670 | $81,169 |
| 2015 | $1,078 | $91,445 | $11,495 | $79,950 |
| 2014 | $1,052 | $89,654 | $11,270 | $78,384 |
Source: Public Records
Map
Nearby Homes
- 2500 N State Highway 59 Unit 36
- 2500 N State Highway 59 Unit 278
- 2500 N State Highway 59 Unit 239
- 2500 N State Highway 59 Unit 18
- 2500 N State Highway 59
- 1963 Shadowbrook Dr
- 1973 Shadowbrook Dr
- 1648 W North Bear Creek Dr
- 1646 W North Bear Creek Dr
- 1664 W North Bear Creek Dr Unit 5
- 1656 W North Bear Creek Dr Unit 9
- 1541 W North Bear Creek Dr
- 2790 N State Highway 59
- 1441 W 20th St
- 1438 W 19th St
- 1482 Autry Way
- 1463 W 25th St
- 1145 W 22nd St
- 3157 Juneau Ct
- 1274 Devonwood Dr
- 2541 Stonybrook Ave
- 2517 Stonybrook Ave
- 2553 Stonybrook Ave
- 2505 Stonybrook Ave
- 1892 Springfield Ct
- 1891 Brookside Dr
- 2565 Stonybrook Ave
- 1880 Springfield Ct
- 1879 Brookside Dr
- 2564 Stonybrook Ave
- 1894 Brookside Dr
- 2577 Stonybrook Ave
- 1892 Brookside Dr
- 1867 Brookside Dr
- 2576 Stonybrook Ave
- 1890 Brookside Dr
- 1869 Springfield Ct
- 2589 Stonybrook Ave
- 1878 Brookside Dr
- 2588 Stonybrook Ave
Your Personal Tour Guide
Ask me questions while you tour the home.