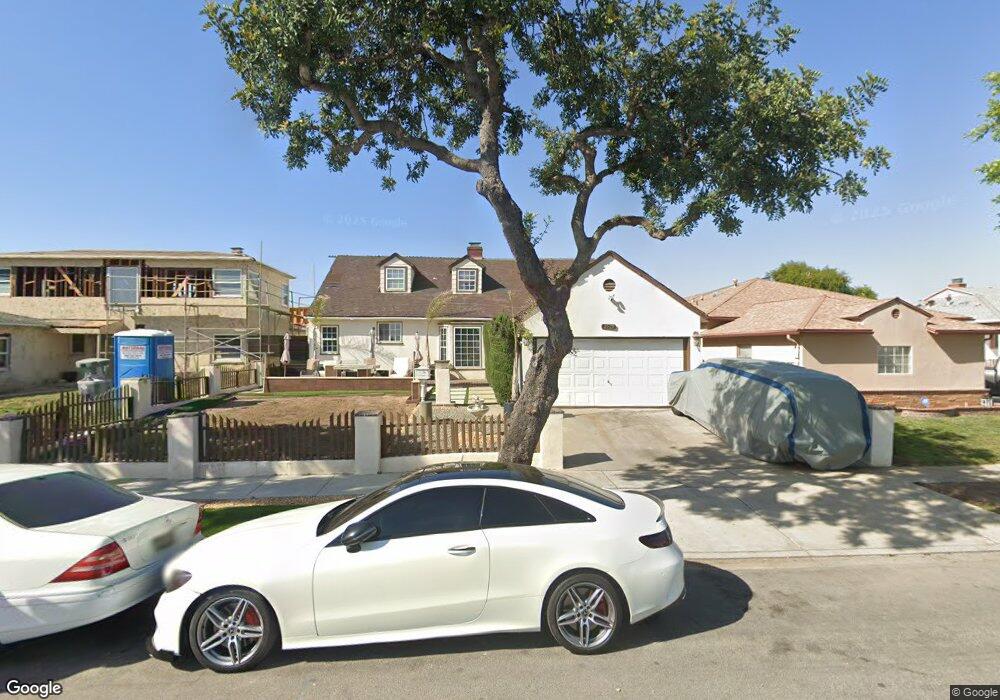
2529 W 102nd St Inglewood, CA 90303
South Inglewood NeighborhoodEstimated Value: $1,021,000 - $1,281,785
5
Beds
3
Baths
3,241
Sq Ft
$359/Sq Ft
Est. Value
About This Home
This home is located at 2529 W 102nd St, Inglewood, CA 90303 and is currently estimated at $1,164,446, approximately $359 per square foot. 2529 W 102nd St is a home located in Los Angeles County with nearby schools including Woodworth - Monroe TK-8 Academy, Monroe (Albert F.) Middle School, and Morningside High School.
Ownership History
Date
Name
Owned For
Owner Type
Purchase Details
Closed on
May 9, 2008
Sold by
Countrywide Bank Fsb
Bought by
Richards James and Richards Barbara
Current Estimated Value
Home Financials for this Owner
Home Financials are based on the most recent Mortgage that was taken out on this home.
Original Mortgage
$531,657
Interest Rate
5.99%
Mortgage Type
FHA
Purchase Details
Closed on
Aug 9, 2007
Sold by
Thompson Gerald
Bought by
Countrywide Bank Fsb
Purchase Details
Closed on
Sep 1, 1999
Sold by
Comins Tommy D
Bought by
Thompson Linda B
Home Financials for this Owner
Home Financials are based on the most recent Mortgage that was taken out on this home.
Original Mortgage
$188,800
Interest Rate
9.75%
Purchase Details
Closed on
Aug 31, 1999
Sold by
Thompson Gerald
Bought by
Thompson Linda B
Home Financials for this Owner
Home Financials are based on the most recent Mortgage that was taken out on this home.
Original Mortgage
$188,800
Interest Rate
9.75%
Create a Home Valuation Report for This Property
The Home Valuation Report is an in-depth analysis detailing your home's value as well as a comparison with similar homes in the area
Home Values in the Area
Average Home Value in this Area
Purchase History
| Date | Buyer | Sale Price | Title Company |
|---|---|---|---|
| Richards James | $540,000 | Landsafe Title | |
| Countrywide Bank Fsb | $514,874 | Landsafe Title | |
| Thompson Linda B | $236,000 | Fidelity National Title Co | |
| Thompson Linda B | -- | Fidelity National Title Co |
Source: Public Records
Mortgage History
| Date | Status | Borrower | Loan Amount |
|---|---|---|---|
| Previous Owner | Richards James | $531,657 | |
| Previous Owner | Thompson Linda B | $188,800 | |
| Closed | Thompson Linda B | $35,400 |
Source: Public Records
Tax History Compared to Growth
Tax History
| Year | Tax Paid | Tax Assessment Tax Assessment Total Assessment is a certain percentage of the fair market value that is determined by local assessors to be the total taxable value of land and additions on the property. | Land | Improvement |
|---|---|---|---|---|
| 2025 | $9,168 | $695,375 | $515,098 | $180,277 |
| 2024 | $9,168 | $681,742 | $504,999 | $176,743 |
| 2023 | $9,076 | $668,376 | $495,098 | $173,278 |
| 2022 | $9,247 | $655,272 | $485,391 | $169,881 |
| 2021 | $9,150 | $642,424 | $475,874 | $166,550 |
| 2020 | $8,742 | $635,838 | $470,995 | $164,843 |
| 2019 | $8,601 | $623,371 | $461,760 | $161,611 |
| 2018 | $8,499 | $611,149 | $452,706 | $158,443 |
| 2016 | $8,035 | $587,420 | $435,128 | $152,292 |
| 2015 | $6,624 | $475,000 | $352,100 | $122,900 |
| 2014 | $6,741 | $475,000 | $352,100 | $122,900 |
Source: Public Records
Map
Nearby Homes
- 10233 S 5th Ave
- 2417 W 101st St
- 9813 S 3rd Ave
- 10225 S 7th Ave
- 10401 S 7th Ave
- 10404 S 3rd Ave
- 10519 S 3rd Ave
- 10421 S 1st Ave
- 10525 S 5th Ave
- 9710 S 8th Ave
- 10401 S Van Ness Ave
- 9606 S 4th Ave
- 10525 S 8th Ave
- 9806 S Van Ness Ave
- 3209 Bartdon Ave
- 10607 Crenshaw Blvd
- 10619 Crenshaw Blvd
- 10725 S 8th Ave
- 10625 Crenshaw Blvd
- 2709 W 109th St
- 2525 W 102nd St
- 2601 W 102nd St
- 2521 W 102nd St
- 2605 W 102nd St
- 2517 W 102nd St
- 2609 W 102nd St
- 2524 W 101st St
- 2520 W 101st St
- 2600 W 101st St
- 2516 W 101st St
- 2604 W 101st St
- 2613 W 102nd St
- 2513 W 102nd St
- 2600 W 102nd St
- 2520 W 102nd St
- 2512 W 101st St
- 2516 W 102nd St
- 2608 W 101st St
- 2512 W 102nd St
- 2509 W 102nd St