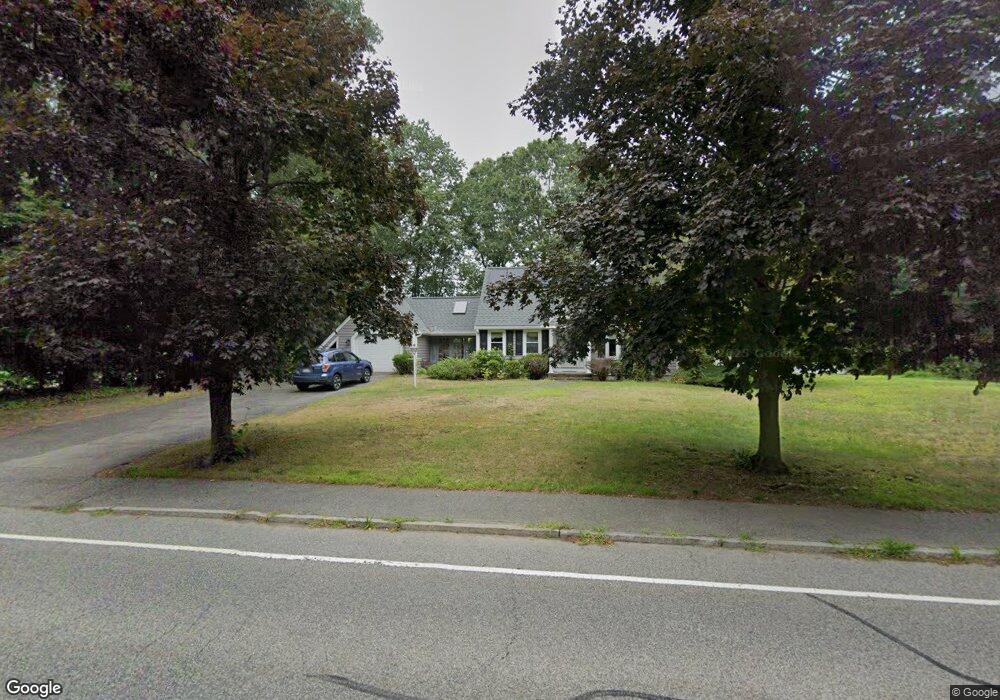
253 Cedar St Hanover, MA 02339
Estimated Value: $666,590 - $748,000
3
Beds
2
Baths
1,469
Sq Ft
$478/Sq Ft
Est. Value
About This Home
This home is located at 253 Cedar St, Hanover, MA 02339 and is currently estimated at $701,898, approximately $477 per square foot. 253 Cedar St is a home located in Plymouth County with nearby schools including Hanover High School and The Master's Academy.
Ownership History
Date
Name
Owned For
Owner Type
Purchase Details
Closed on
Nov 30, 2004
Sold by
Florio Patricia A and Florio Fred P
Bought by
Sherwood Jonathan and Sherwood Angela
Current Estimated Value
Purchase Details
Closed on
Nov 30, 1994
Sold by
Tinto Guy R and Tinto Mary M
Bought by
Florio Fred P and Florio Patricia A
Create a Home Valuation Report for This Property
The Home Valuation Report is an in-depth analysis detailing your home's value as well as a comparison with similar homes in the area
Home Values in the Area
Average Home Value in this Area
Purchase History
| Date | Buyer | Sale Price | Title Company |
|---|---|---|---|
| Sherwood Jonathan | $397,700 | -- | |
| Florio Fred P | $171,400 | -- |
Source: Public Records
Mortgage History
| Date | Status | Borrower | Loan Amount |
|---|---|---|---|
| Open | Florio Fred P | $344,000 | |
| Closed | Florio Fred P | $43,000 |
Source: Public Records
Tax History
| Year | Tax Paid | Tax Assessment Tax Assessment Total Assessment is a certain percentage of the fair market value that is determined by local assessors to be the total taxable value of land and additions on the property. | Land | Improvement |
|---|---|---|---|---|
| 2025 | $7,354 | $595,500 | $269,600 | $325,900 |
| 2024 | $7,187 | $559,700 | $269,600 | $290,100 |
| 2023 | $6,831 | $506,400 | $245,100 | $261,300 |
| 2022 | $7,084 | $464,500 | $232,800 | $231,700 |
| 2021 | $6,731 | $412,200 | $189,400 | $222,800 |
| 2020 | $6,840 | $419,400 | $200,500 | $218,900 |
| 2019 | $6,406 | $390,400 | $200,500 | $189,900 |
| 2018 | $6,294 | $386,600 | $200,500 | $186,100 |
| 2017 | $5,713 | $345,800 | $199,500 | $146,300 |
| 2016 | $5,582 | $331,100 | $181,400 | $149,700 |
| 2015 | $5,023 | $311,000 | $168,100 | $142,900 |
Source: Public Records
Map
Nearby Homes
- 506 Main St
- 47 Stone Meadow Ln
- 44 Stone Meadow Ln
- 776 Main St
- 36 Bayberry Ln
- 62 Larchmont Ln
- 168 Larchmont Ln
- 561 Circuit St
- 535 Webster St
- 46 Brookwood Rd
- 53 Chestnut St
- 823 Market St
- 75 School St
- 36 Grove St
- 127 King St
- 250 Center St
- 51 Cervelli Farm Dr
- 37 Dr
- 23 Cervelli Farm Dr
- 38 Cervelli Farm Dr
Your Personal Tour Guide
Ask me questions while you tour the home.