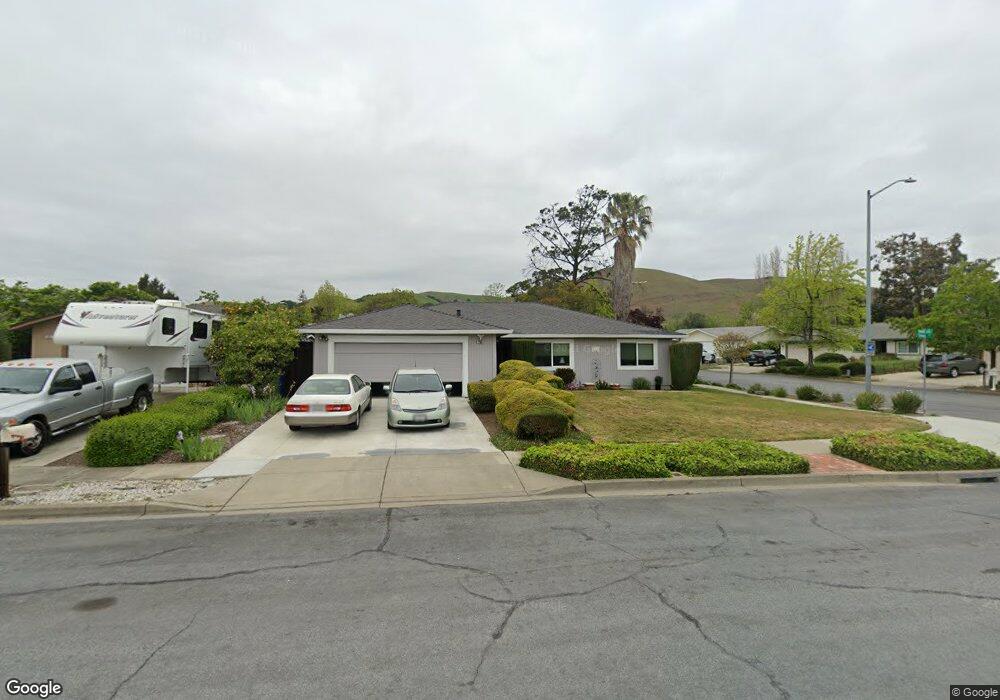
253 Chase Ct Fremont, CA 94536
Niles NeighborhoodEstimated Value: $1,176,000 - $1,565,000
4
Beds
2
Baths
1,614
Sq Ft
$891/Sq Ft
Est. Value
About This Home
This home is located at 253 Chase Ct, Fremont, CA 94536 and is currently estimated at $1,438,788, approximately $891 per square foot. 253 Chase Ct is a home located in Alameda County with nearby schools including Niles Elementary School, Centerville Junior High School, and Washington High School.
Ownership History
Date
Name
Owned For
Owner Type
Purchase Details
Closed on
Jul 27, 2020
Sold by
Burow Jacqueline and The Trust For Benjamin Roller
Bought by
Weed John Hampton and Cole Carol
Current Estimated Value
Home Financials for this Owner
Home Financials are based on the most recent Mortgage that was taken out on this home.
Original Mortgage
$765,000
Outstanding Balance
$679,862
Interest Rate
3.1%
Mortgage Type
New Conventional
Estimated Equity
$758,926
Purchase Details
Closed on
Dec 31, 2016
Sold by
Roller Benjamin Thomas
Bought by
Roller Paul and Ziegenhagel Sharon
Purchase Details
Closed on
Dec 19, 2016
Sold by
Roller Paul A and Roller Stephen A
Bought by
Roller Benjamin Thomas
Purchase Details
Closed on
Dec 1, 2012
Sold by
Roller Stephen A and Houk Theresa C
Bought by
Roller Stephen A
Purchase Details
Closed on
Mar 20, 2007
Sold by
Roller Stephen
Bought by
Roller Stephen A and Houk Theresa C
Purchase Details
Closed on
Feb 20, 2001
Sold by
Roller Sharon
Bought by
Roller Stephen
Create a Home Valuation Report for This Property
The Home Valuation Report is an in-depth analysis detailing your home's value as well as a comparison with similar homes in the area
Home Values in the Area
Average Home Value in this Area
Purchase History
| Date | Buyer | Sale Price | Title Company |
|---|---|---|---|
| Weed John Hampton | $1,050,000 | Old Republic Title Company | |
| Roller Paul | -- | None Available | |
| Roller Benjamin Thomas | -- | None Available | |
| Roller Stephen A | -- | None Available | |
| Roller Stephen A | -- | None Available | |
| Roller Stephen | -- | -- |
Source: Public Records
Mortgage History
| Date | Status | Borrower | Loan Amount |
|---|---|---|---|
| Open | Weed John Hampton | $765,000 |
Source: Public Records
Tax History
| Year | Tax Paid | Tax Assessment Tax Assessment Total Assessment is a certain percentage of the fair market value that is determined by local assessors to be the total taxable value of land and additions on the property. | Land | Improvement |
|---|---|---|---|---|
| 2025 | $13,443 | $1,136,540 | $454,616 | $681,924 |
| 2024 | $13,443 | $1,114,260 | $445,704 | $668,556 |
| 2023 | $13,092 | $1,092,420 | $436,968 | $655,452 |
| 2022 | $12,935 | $1,071,000 | $428,400 | $642,600 |
| 2021 | $12,615 | $1,050,000 | $420,000 | $630,000 |
| 2020 | $2,423 | $154,978 | $49,595 | $105,383 |
| 2019 | $2,400 | $151,939 | $48,622 | $103,317 |
| 2018 | $2,351 | $148,960 | $47,669 | $101,291 |
| 2017 | $2,293 | $146,040 | $46,735 | $99,305 |
| 2016 | $2,242 | $143,177 | $45,818 | $97,359 |
| 2015 | $2,200 | $141,027 | $45,130 | $95,897 |
| 2014 | $2,153 | $138,264 | $44,246 | $94,018 |
Source: Public Records
Map
Nearby Homes
- 191 Sierra Terrace
- 37915 Vallejo St
- 35796 Mission Blvd
- 339 I St
- 111 Overacker Terrace
- 38581 Aventura Terrace
- 38555 Overacker Ave
- 51 Sea Crest Terrace
- 711 Old Canyon Rd Unit 81
- 711 Old Canyon Rd Unit 6
- 711 Old Canyon Rd Unit 176
- 711 Old Canyon Rd Unit 103
- 711 Old Canyon Rd Unit 27
- 711 Old Canyon Rd Unit 56
- 38614 Royal Ann Common
- 38627 Cherry Ln Unit 54
- 37230 2nd St
- 38467 Timpanogas Cir
- 37286 3rd St
- 18 Gazania Terrace
Your Personal Tour Guide
Ask me questions while you tour the home.