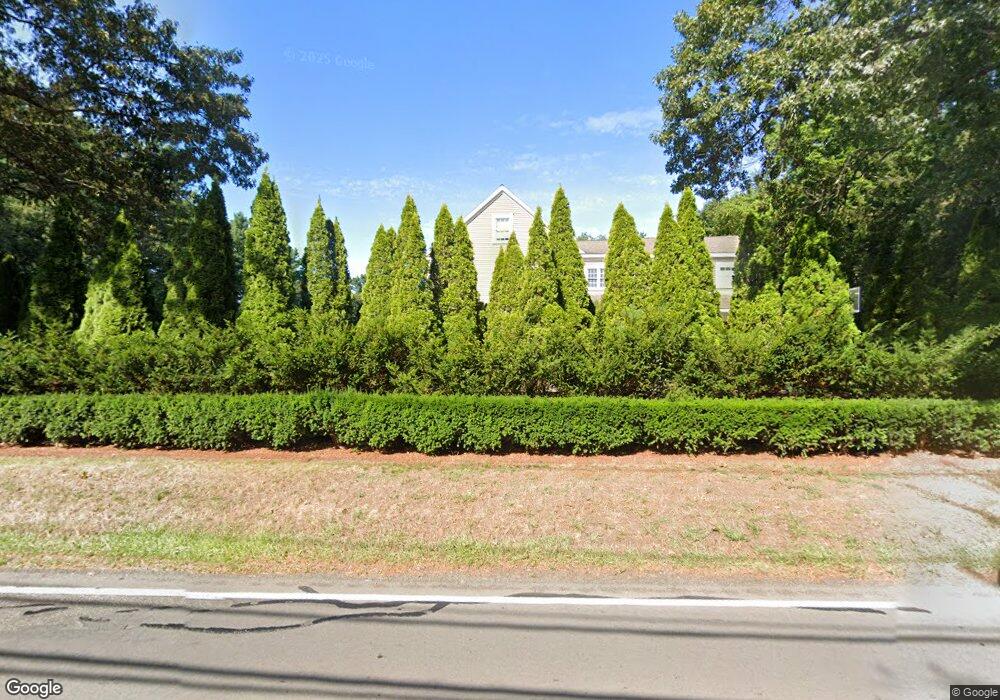
253 Cushing St Hingham, MA 02043
South Hingham NeighborhoodEstimated Value: $1,867,000 - $2,801,000
3
Beds
2
Baths
1,280
Sq Ft
$1,671/Sq Ft
Est. Value
About This Home
This home is located at 253 Cushing St, Hingham, MA 02043 and is currently estimated at $2,138,803, approximately $1,670 per square foot. 253 Cushing St is a home located in Plymouth County with nearby schools including South Elementary School, Hingham Middle School, and Hingham High School.
Ownership History
Date
Name
Owned For
Owner Type
Purchase Details
Closed on
Sep 10, 2002
Sold by
Morton John D
Bought by
Moraites Michael T and Moraites Lynn A
Current Estimated Value
Purchase Details
Closed on
Sep 30, 1996
Sold by
Coghlan Kevin M and Coghlan Kathleen B
Bought by
Morton John D
Create a Home Valuation Report for This Property
The Home Valuation Report is an in-depth analysis detailing your home's value as well as a comparison with similar homes in the area
Home Values in the Area
Average Home Value in this Area
Purchase History
| Date | Buyer | Sale Price | Title Company |
|---|---|---|---|
| Moraites Michael T | $385,000 | -- | |
| Morton John D | $168,000 | -- |
Source: Public Records
Mortgage History
| Date | Status | Borrower | Loan Amount |
|---|---|---|---|
| Open | Morton John D | $560,000 | |
| Closed | Morton John D | $322,700 |
Source: Public Records
Tax History Compared to Growth
Tax History
| Year | Tax Paid | Tax Assessment Tax Assessment Total Assessment is a certain percentage of the fair market value that is determined by local assessors to be the total taxable value of land and additions on the property. | Land | Improvement |
|---|---|---|---|---|
| 2025 | $19,366 | $1,811,600 | $642,900 | $1,168,700 |
| 2024 | $15,662 | $1,443,500 | $642,900 | $800,600 |
| 2023 | $13,777 | $1,377,700 | $642,900 | $734,800 |
| 2022 | $13,002 | $1,124,700 | $534,200 | $590,500 |
| 2021 | $13,048 | $1,105,800 | $556,400 | $549,400 |
| 2020 | $12,750 | $1,105,800 | $556,400 | $549,400 |
| 2019 | $12,638 | $1,070,100 | $556,400 | $513,700 |
| 2018 | $12,595 | $1,070,100 | $556,400 | $513,700 |
| 2017 | $11,996 | $979,300 | $555,600 | $423,700 |
| 2016 | $11,900 | $952,800 | $529,100 | $423,700 |
| 2015 | $11,916 | $951,000 | $343,000 | $608,000 |
Source: Public Records
Map
Nearby Homes
- 2 Black Rock Dr Unit 21
- 2 Black Rock Dr
- 4 Kerri Ln
- 1 Kerri Ln
- 86 Black Rock Dr
- 18 Whiting Ln
- 955 Pleasant St Unit 11
- 249 High St
- 72 Scotland St
- 100 Whiting St
- 14 Old Stone Way Unit 11
- 4 Richard Rd
- 9 Cranberry Ln
- 14 Mutton Ln
- 38 Twilight Path
- 38 School St Unit 2
- 31 School St
- 126 Lakehurst Ave
- 16 Oak Cliff Rd
- 1015 Washington St
- 2 Appletree Ln
- 249 Cushing St
- 263 Cushing St
- 260 Cushing St
- 1 Appletree Ln
- 243 Cushing St
- 244 Cushing St
- 1 Plymouth River Rd
- 5 Plymouth River Rd
- 3 Plymouth River Rd
- 7 Plymouth River Rd
- 239 Cushing St
- 9 Plymouth River Rd
- 250 Cushing St
- 11 Plymouth River Rd
- 231 Cushing St
- 248 Cushing St
- 4 Plymouth River Rd
- 236 Cushing St
- 291 Cushing St