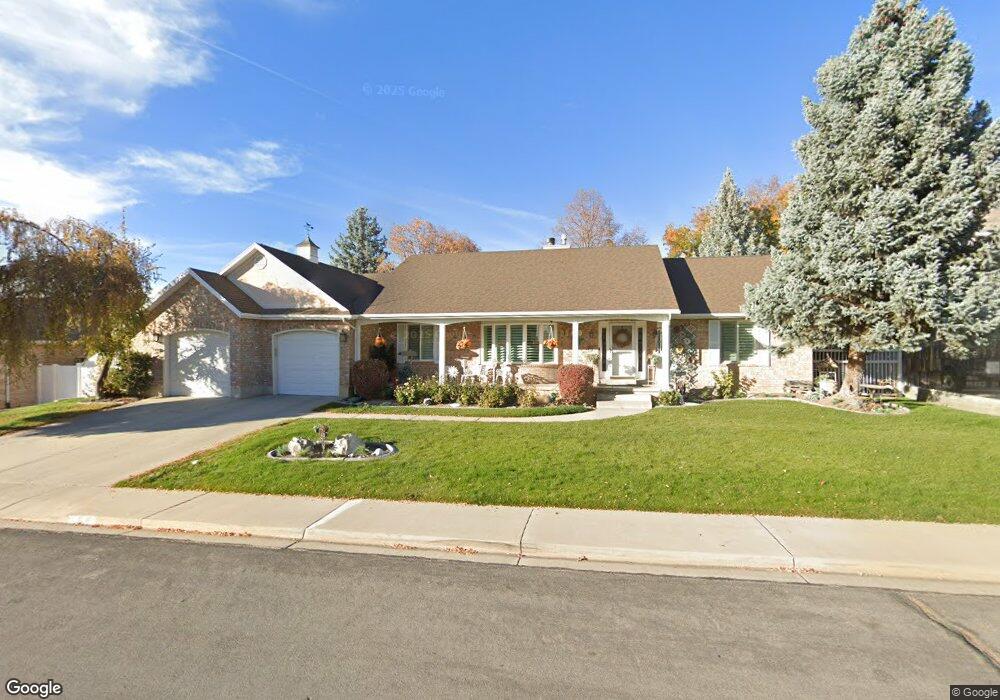
253 E 1620 N Orem, UT 84057
Northridge NeighborhoodEstimated Value: $639,907 - $733,000
3
Beds
3
Baths
2,261
Sq Ft
$308/Sq Ft
Est. Value
About This Home
This home is located at 253 E 1620 N, Orem, UT 84057 and is currently estimated at $696,969, approximately $308 per square foot. 253 E 1620 N is a home located in Utah County with nearby schools including Northridge Elementary School, Oak Canyon Junior High School, and Timpanogos High School.
Ownership History
Date
Name
Owned For
Owner Type
Purchase Details
Closed on
Mar 19, 2019
Sold by
Ostlund Ostlund Eulala Darlene Butteres Eulala Darlene Butte and Ostlund Tarrant Jamie
Bought by
Ostlund Ostlund Eulala Darlene Butters Eulala Darlene Butter and Ostlund Tarrant Jamie
Current Estimated Value
Purchase Details
Closed on
Dec 10, 2009
Sold by
Butters Ostlund James Jonas and Butters Ostlund Eulala Darlene
Bought by
Butters Ostlund James Jonas and Butters Ostlund Eulala Darlene
Home Financials for this Owner
Home Financials are based on the most recent Mortgage that was taken out on this home.
Original Mortgage
$35,000
Interest Rate
5.01%
Mortgage Type
New Conventional
Purchase Details
Closed on
Aug 17, 2005
Sold by
Ostlund James J and Ostlund Darlene B
Bought by
Butters Ostlund James Jonas and Butters Ostlund Eulala Darlene
Create a Home Valuation Report for This Property
The Home Valuation Report is an in-depth analysis detailing your home's value as well as a comparison with similar homes in the area
Home Values in the Area
Average Home Value in this Area
Purchase History
| Date | Buyer | Sale Price | Title Company |
|---|---|---|---|
| Ostlund Ostlund Eulala Darlene Butters Eulala Darlene Butter | -- | None Available | |
| Butters Ostlund James Jonas | -- | None Available | |
| Butters Ostlund James Jonas | -- | First American Lenders Ti | |
| Butters Ostlund James Jonas | -- | -- |
Source: Public Records
Mortgage History
| Date | Status | Borrower | Loan Amount |
|---|---|---|---|
| Closed | Butters Ostlund James Jonas | $35,000 |
Source: Public Records
Tax History
| Year | Tax Paid | Tax Assessment Tax Assessment Total Assessment is a certain percentage of the fair market value that is determined by local assessors to be the total taxable value of land and additions on the property. | Land | Improvement |
|---|---|---|---|---|
| 2025 | $2,699 | $365,860 | -- | -- |
| 2024 | $2,699 | $330,000 | $0 | $0 |
| 2023 | $2,513 | $330,220 | $0 | $0 |
| 2022 | $2,793 | $355,575 | $0 | $0 |
| 2021 | $2,528 | $487,500 | $187,200 | $300,300 |
| 2020 | $2,368 | $448,800 | $162,800 | $286,000 |
| 2019 | $2,088 | $411,500 | $162,800 | $248,700 |
| 2018 | $2,185 | $411,500 | $162,800 | $248,700 |
| 2017 | $1,739 | $175,395 | $0 | $0 |
| 2016 | $1,886 | $175,395 | $0 | $0 |
| 2015 | $1,894 | $166,595 | $0 | $0 |
| 2014 | $1,889 | $165,385 | $0 | $0 |
Source: Public Records
Map
Nearby Homes
- 193 E 1570 N
- 1636 N 160 E
- 1638 N 160 E
- 363 E 1395 N Unit 22
- 1371 N 330 E Unit 8
- 540 E Quail Rd
- 49 W 1880 N
- 372 E 1165 N
- 695 E 1870 N
- 1643 N Mountain Oaks Dr
- 713 E 1450 N Unit 23
- 713 E 1500 St N Unit 19
- 110 S 1320 E
- 1566 N 275 West St Unit 1
- 733 E 1450 N Unit 5
- 1547 N 275 West St Unit 5
- 747 E 1500 N Unit 13
- 1366 N 750 E
- 1356 N 750 E Unit 11
- 710 E 1280 N
Your Personal Tour Guide
Ask me questions while you tour the home.