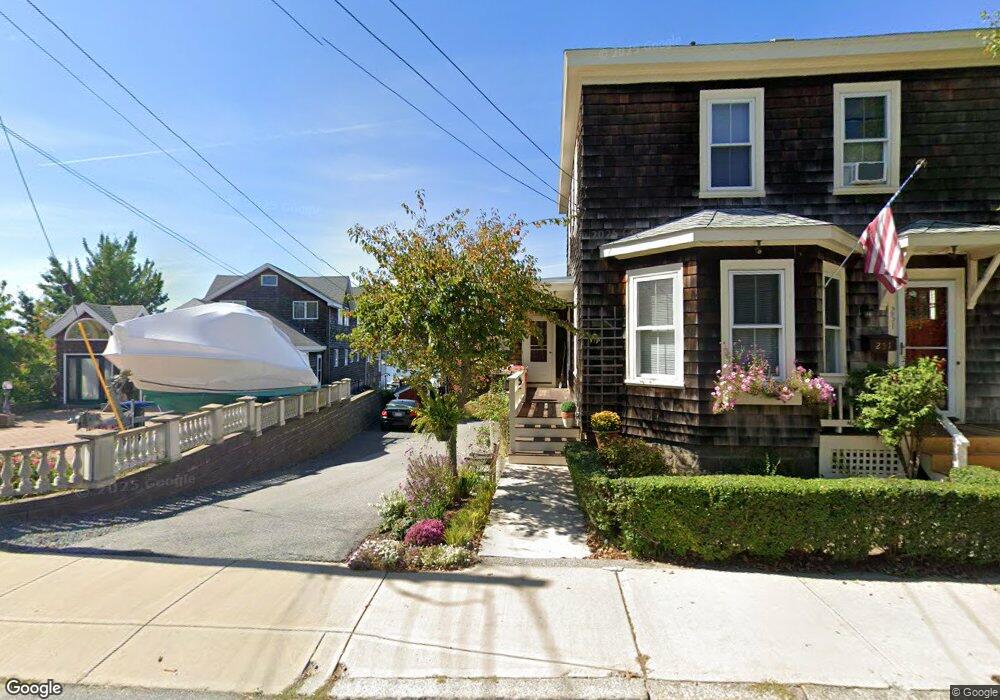
253 E Main St Gloucester, MA 01930
East Gloucester NeighborhoodEstimated Value: $903,000 - $1,953,000
2
Beds
2
Baths
1,312
Sq Ft
$1,122/Sq Ft
Est. Value
About This Home
This home is located at 253 E Main St, Gloucester, MA 01930 and is currently estimated at $1,472,648, approximately $1,122 per square foot. 253 E Main St is a home located in Essex County with nearby schools including East Gloucester Elementary School, Ralph B O'maley Middle School, and Gloucester High School.
Ownership History
Date
Name
Owned For
Owner Type
Purchase Details
Closed on
Jul 9, 1990
Sold by
Lester J Wells
Bought by
Bradshaw R Bruce
Current Estimated Value
Home Financials for this Owner
Home Financials are based on the most recent Mortgage that was taken out on this home.
Original Mortgage
$115,000
Interest Rate
10.23%
Mortgage Type
Purchase Money Mortgage
Create a Home Valuation Report for This Property
The Home Valuation Report is an in-depth analysis detailing your home's value as well as a comparison with similar homes in the area
Home Values in the Area
Average Home Value in this Area
Purchase History
| Date | Buyer | Sale Price | Title Company |
|---|---|---|---|
| Bradshaw R Bruce | $225,000 | -- |
Source: Public Records
Mortgage History
| Date | Status | Borrower | Loan Amount |
|---|---|---|---|
| Open | Bradshaw R Bruce | $193,000 | |
| Closed | Bradshaw R Bruce | $215,000 | |
| Closed | Bradshaw R Bruce | $115,000 |
Source: Public Records
Tax History
| Year | Tax Paid | Tax Assessment Tax Assessment Total Assessment is a certain percentage of the fair market value that is determined by local assessors to be the total taxable value of land and additions on the property. | Land | Improvement |
|---|---|---|---|---|
| 2025 | $14,668 | $1,509,100 | $1,145,500 | $363,600 |
| 2024 | $14,151 | $1,454,400 | $1,090,800 | $363,600 |
| 2023 | $13,235 | $1,249,800 | $931,100 | $318,700 |
| 2022 | $12,782 | $1,089,700 | $809,500 | $280,200 |
| 2021 | $12,332 | $991,300 | $735,500 | $255,800 |
| 2020 | $12,145 | $985,000 | $735,500 | $249,500 |
| 2019 | $11,766 | $927,200 | $701,300 | $225,900 |
| 2018 | $11,475 | $887,500 | $684,200 | $203,300 |
| 2017 | $11,140 | $844,600 | $651,400 | $193,200 |
| 2016 | $10,766 | $791,000 | $623,000 | $168,000 |
| 2015 | $10,437 | $764,600 | $608,800 | $155,800 |
Source: Public Records
Map
Nearby Homes
- 73 Rocky Neck Ave Unit 2
- 197 E Main St Unit 1
- 197 E Main St Unit 2
- 15 Raven Ln Unit 15
- 30 Chapel St Unit B
- 10 Seaview Rd
- 191 Main St Unit 3
- 191 Main St Unit 2A
- 160 Prospect St Unit 3
- 11 Ocean View Dr
- 33 Middle St
- 55 Mansfield St Unit A
- 55 Mansfield St Unit B
- 55 Mansfield St
- 10 Oak St Unit 3
- 33 Maplewood Ave Unit 16
- 5 Wise Place
- 20 Beacon St Unit 2
- 20 Beacon St Unit 1
- 19 Trask St Unit 2
Your Personal Tour Guide
Ask me questions while you tour the home.