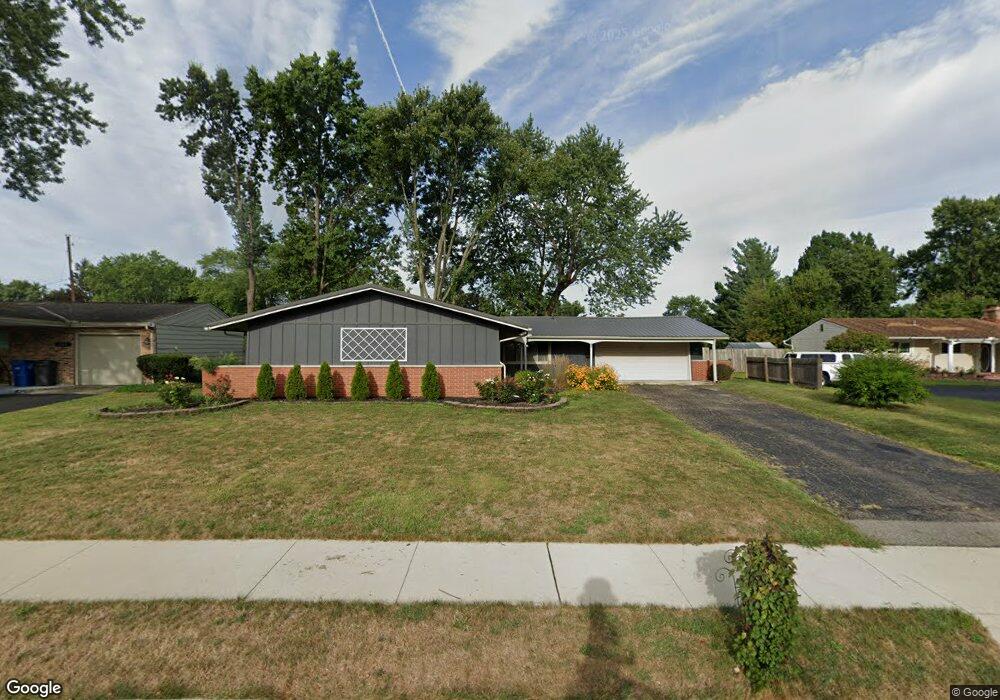
253 Flint Ridge Dr Columbus, OH 43230
Gahanna-Havens Corners NeighborhoodEstimated Value: $335,000 - $355,000
3
Beds
2
Baths
1,608
Sq Ft
$215/Sq Ft
Est. Value
About This Home
This home is located at 253 Flint Ridge Dr, Columbus, OH 43230 and is currently estimated at $344,917, approximately $214 per square foot. 253 Flint Ridge Dr is a home located in Franklin County with nearby schools including Goshen Lane Elementary School, Gahanna East Middle School, and Lincoln High School.
Ownership History
Date
Name
Owned For
Owner Type
Purchase Details
Closed on
Dec 18, 2009
Sold by
Pritchard Carol J and Shambaugh Cheryl Ann
Bought by
Hood Shaun M and Hood Molly S
Current Estimated Value
Home Financials for this Owner
Home Financials are based on the most recent Mortgage that was taken out on this home.
Original Mortgage
$153,122
Outstanding Balance
$100,182
Interest Rate
4.96%
Mortgage Type
VA
Estimated Equity
$244,735
Purchase Details
Closed on
Dec 27, 2005
Sold by
Disbennett Cindy L
Bought by
Pritchard Benjamin L and Pritchard Carol J
Home Financials for this Owner
Home Financials are based on the most recent Mortgage that was taken out on this home.
Original Mortgage
$123,900
Interest Rate
6.34%
Mortgage Type
Fannie Mae Freddie Mac
Purchase Details
Closed on
Jun 7, 1998
Sold by
Zipf Erick A
Bought by
Disbennett Cindy L
Purchase Details
Closed on
Oct 23, 1991
Create a Home Valuation Report for This Property
The Home Valuation Report is an in-depth analysis detailing your home's value as well as a comparison with similar homes in the area
Home Values in the Area
Average Home Value in this Area
Purchase History
| Date | Buyer | Sale Price | Title Company |
|---|---|---|---|
| Hood Shaun M | $149,900 | None Available | |
| Pritchard Benjamin L | $154,900 | Metropolita | |
| Disbennett Cindy L | -- | Independent Title | |
| -- | $84,900 | -- |
Source: Public Records
Mortgage History
| Date | Status | Borrower | Loan Amount |
|---|---|---|---|
| Open | Hood Shaun M | $153,122 | |
| Closed | Pritchard Benjamin L | $123,900 |
Source: Public Records
Tax History Compared to Growth
Tax History
| Year | Tax Paid | Tax Assessment Tax Assessment Total Assessment is a certain percentage of the fair market value that is determined by local assessors to be the total taxable value of land and additions on the property. | Land | Improvement |
|---|---|---|---|---|
| 2024 | $5,783 | $96,220 | $28,320 | $67,900 |
| 2023 | $5,712 | $96,215 | $28,315 | $67,900 |
| 2022 | $4,543 | $59,610 | $13,370 | $46,240 |
| 2021 | $4,397 | $59,610 | $13,370 | $46,240 |
| 2020 | $4,362 | $59,610 | $13,370 | $46,240 |
| 2019 | $3,693 | $50,200 | $11,170 | $39,030 |
| 2018 | $3,675 | $50,200 | $11,170 | $39,030 |
| 2017 | $3,307 | $50,200 | $11,170 | $39,030 |
| 2016 | $3,770 | $52,120 | $17,190 | $34,930 |
| 2015 | $3,773 | $52,120 | $17,190 | $34,930 |
| 2014 | $3,744 | $52,120 | $17,190 | $34,930 |
| 2013 | $1,830 | $51,310 | $16,380 | $34,930 |
Source: Public Records
Map
Nearby Homes
- 183 Serran Dr
- 198 Gary Lee Dr
- 219 N Hamilton Rd
- 206 Lintner St
- 379 Heil Dr
- 745 Fleetrun Ave
- 714 Schyler Ct
- 311 N Hamilton Rd
- 610 Chadwood Dr
- 373 Lyncroft Dr
- 390 Dunbarton Rd
- 407 Denison Ave
- 536 Tresham Rd
- 209 Springbrook Place
- 236 Winfall Dr
- 317 Sycamore Ridge Way Unit 317
- 497 Uxbridge Ave
- 174 Grand Ridge Ct
- 657 Picadilly Ct
- 175 Stonegate Cir
- 261 Flint Ridge Dr
- 243 Flint Ridge Dr
- 258 Broken Arrow Rd
- 266 Broken Arrow Rd
- 267 Flint Ridge Dr
- 254 Flint Ridge Dr
- 233 Flint Ridge Dr
- 311 Rocky Fork Dr N
- 274 Broken Arrow Rd
- 244 Flint Ridge Dr
- 252 Broken Arrow Rd
- 275 Flint Ridge Dr
- 236 Flint Ridge Dr
- 280 Broken Arrow Rd
- 297 Rocky Fork Dr N
- 270 Flint Ridge Dr
- 335 Rocky Fork Dr N
- 281 Flint Ridge Dr
- 344 Bow Dr
- 265 Broken Arrow Rd