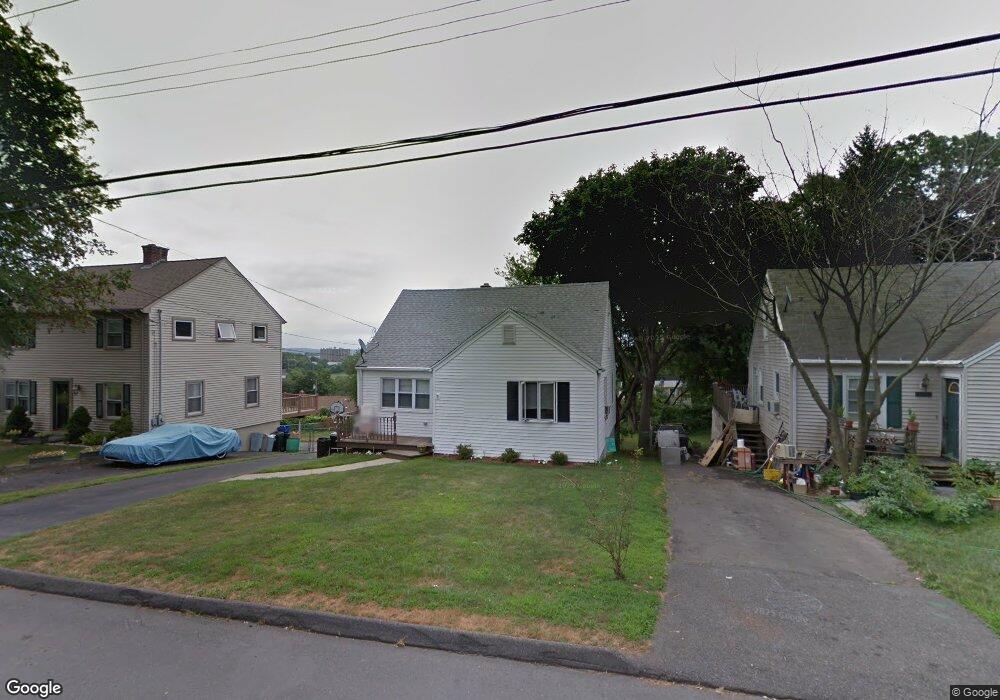
253 Highland Ave West Haven, CT 06516
West Shore NeighborhoodEstimated Value: $381,000 - $461,000
3
Beds
2
Baths
1,200
Sq Ft
$338/Sq Ft
Est. Value
About This Home
This home is located at 253 Highland Ave, West Haven, CT 06516 and is currently estimated at $405,748, approximately $338 per square foot. 253 Highland Ave is a home located in New Haven County with nearby schools including Carrigan 5/6 Intermediate School, Harry M. Bailey Middle School, and West Haven High School.
Ownership History
Date
Name
Owned For
Owner Type
Purchase Details
Closed on
Jul 16, 1993
Sold by
Gordan David J
Bought by
Uscilla Sandra L
Current Estimated Value
Home Financials for this Owner
Home Financials are based on the most recent Mortgage that was taken out on this home.
Original Mortgage
$45,000
Interest Rate
7.4%
Mortgage Type
Purchase Money Mortgage
Purchase Details
Closed on
Jul 8, 1992
Sold by
Federal Home Loan Mortgage Corporation
Bought by
Gordon David J
Purchase Details
Closed on
May 13, 1992
Sold by
Petito Joseph A and Petito Kathleen M
Bought by
Citicorp Mtg Inc
Create a Home Valuation Report for This Property
The Home Valuation Report is an in-depth analysis detailing your home's value as well as a comparison with similar homes in the area
Home Values in the Area
Average Home Value in this Area
Purchase History
| Date | Buyer | Sale Price | Title Company |
|---|---|---|---|
| Uscilla Sandra L | $113,000 | -- | |
| Gordon David J | $87,000 | -- | |
| Uscilla Sandra L | $113,000 | -- | |
| Gordon David J | $87,000 | -- | |
| Citicorp Mtg Inc | $91,000 | -- |
Source: Public Records
Mortgage History
| Date | Status | Borrower | Loan Amount |
|---|---|---|---|
| Closed | Citicorp Mtg Inc | $45,000 |
Source: Public Records
Tax History Compared to Growth
Tax History
| Year | Tax Paid | Tax Assessment Tax Assessment Total Assessment is a certain percentage of the fair market value that is determined by local assessors to be the total taxable value of land and additions on the property. | Land | Improvement |
|---|---|---|---|---|
| 2025 | $7,664 | $233,170 | $103,040 | $130,130 |
| 2024 | $7,102 | $151,550 | $71,330 | $80,220 |
| 2023 | $6,835 | $151,550 | $71,330 | $80,220 |
| 2022 | $6,712 | $151,550 | $71,330 | $80,220 |
| 2021 | $6,712 | $151,550 | $71,330 | $80,220 |
| 2020 | $6,717 | $138,180 | $65,240 | $72,940 |
| 2019 | $6,503 | $138,180 | $65,240 | $72,940 |
| 2018 | $4,912 | $138,180 | $65,240 | $72,940 |
| 2017 | $6,237 | $138,180 | $65,240 | $72,940 |
| 2016 | $6,168 | $138,180 | $65,240 | $72,940 |
| 2015 | $6,075 | $152,320 | $72,030 | $80,290 |
| 2014 | $6,075 | $152,320 | $72,030 | $80,290 |
Source: Public Records
Map
Nearby Homes