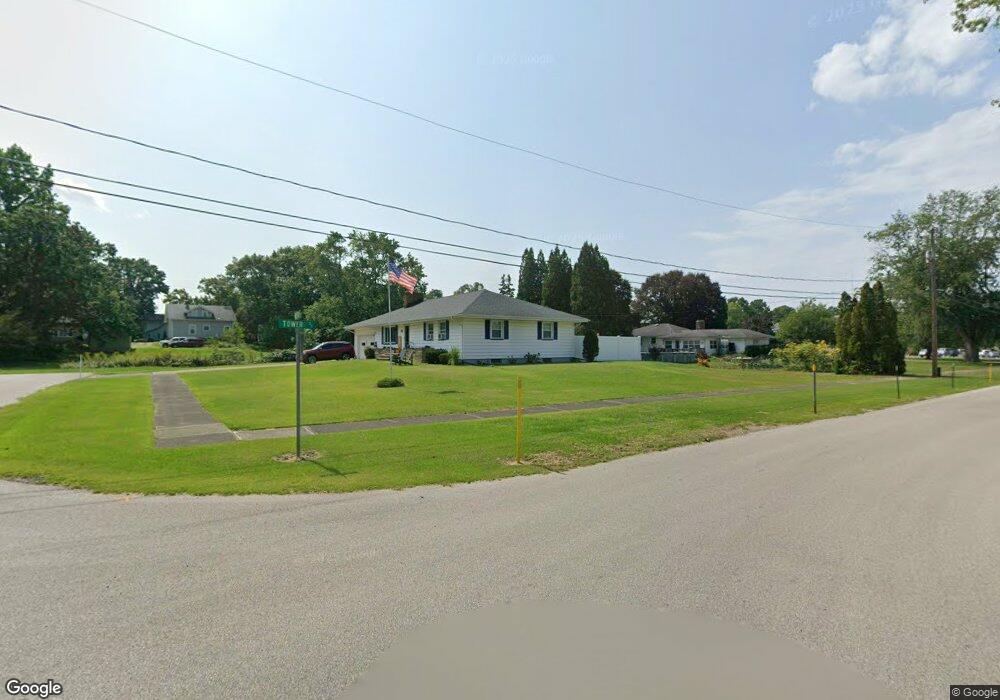
253 Hosford Ave Conneaut, OH 44030
Estimated Value: $154,000 - $211,000
3
Beds
1
Bath
1,380
Sq Ft
$134/Sq Ft
Est. Value
About This Home
This home is located at 253 Hosford Ave, Conneaut, OH 44030 and is currently estimated at $185,180, approximately $134 per square foot. 253 Hosford Ave is a home located in Ashtabula County with nearby schools including Lakeshore Primary Elementary School, Gateway Elementary School, and Conneaut Middle School.
Ownership History
Date
Name
Owned For
Owner Type
Purchase Details
Closed on
Jan 6, 2022
Sold by
Loomis Randy L and Loomis Catherine M
Bought by
Long James Alan
Current Estimated Value
Home Financials for this Owner
Home Financials are based on the most recent Mortgage that was taken out on this home.
Original Mortgage
$155,555
Outstanding Balance
$143,382
Interest Rate
3.12%
Mortgage Type
New Conventional
Estimated Equity
$41,798
Purchase Details
Closed on
Jan 24, 2019
Sold by
Rich Paul F and Rich Joann M
Bought by
Loomis Catherine M and Loomis Randy L
Create a Home Valuation Report for This Property
The Home Valuation Report is an in-depth analysis detailing your home's value as well as a comparison with similar homes in the area
Home Values in the Area
Average Home Value in this Area
Purchase History
| Date | Buyer | Sale Price | Title Company |
|---|---|---|---|
| Long James Alan | $154,000 | Jeffery S Watson Law Firm Ltd | |
| Loomis Catherine M | $45,150 | None Available |
Source: Public Records
Mortgage History
| Date | Status | Borrower | Loan Amount |
|---|---|---|---|
| Open | Long James Alan | $155,555 |
Source: Public Records
Tax History Compared to Growth
Tax History
| Year | Tax Paid | Tax Assessment Tax Assessment Total Assessment is a certain percentage of the fair market value that is determined by local assessors to be the total taxable value of land and additions on the property. | Land | Improvement |
|---|---|---|---|---|
| 2024 | $3,805 | $52,020 | $10,400 | $41,620 |
| 2023 | $2,413 | $52,020 | $10,400 | $41,620 |
| 2022 | $2,085 | $38,860 | $8,020 | $30,840 |
| 2021 | $2,120 | $38,860 | $8,020 | $30,840 |
| 2020 | $2,119 | $38,860 | $8,020 | $30,840 |
| 2019 | $1,763 | $31,710 | $4,200 | $27,510 |
| 2018 | $1,677 | $31,610 | $4,100 | $27,510 |
| 2017 | $837 | $31,610 | $4,100 | $27,510 |
| 2016 | $1,610 | $33,040 | $4,270 | $28,770 |
| 2015 | $1,627 | $33,040 | $4,270 | $28,770 |
| 2014 | $1,440 | $33,040 | $4,270 | $28,770 |
| 2013 | $1,583 | $37,390 | $7,320 | $30,070 |
Source: Public Records
Map
Nearby Homes
- 210 W Main Rd
- 202 W Main Rd Unit 49
- 202 W Main Rd Unit Lot 150
- 202 W Main Rd Unit 33
- 202 W Main Rd Unit 16
- 855 Spring St Unit S9
- 247 Whitney St
- 220 Daniels Ave
- 589 Main St
- 18 Hillcrest Ct
- 474 Sherman St
- 536 Madison St
- 1145 Lake Rd
- 455 Main St
- 2663 Lake Rd
- VL Center Rd
- 1150 Lake Rd
- 251 St Rt 7
- 57 Eaton Dr
- 40 Oakland Blvd