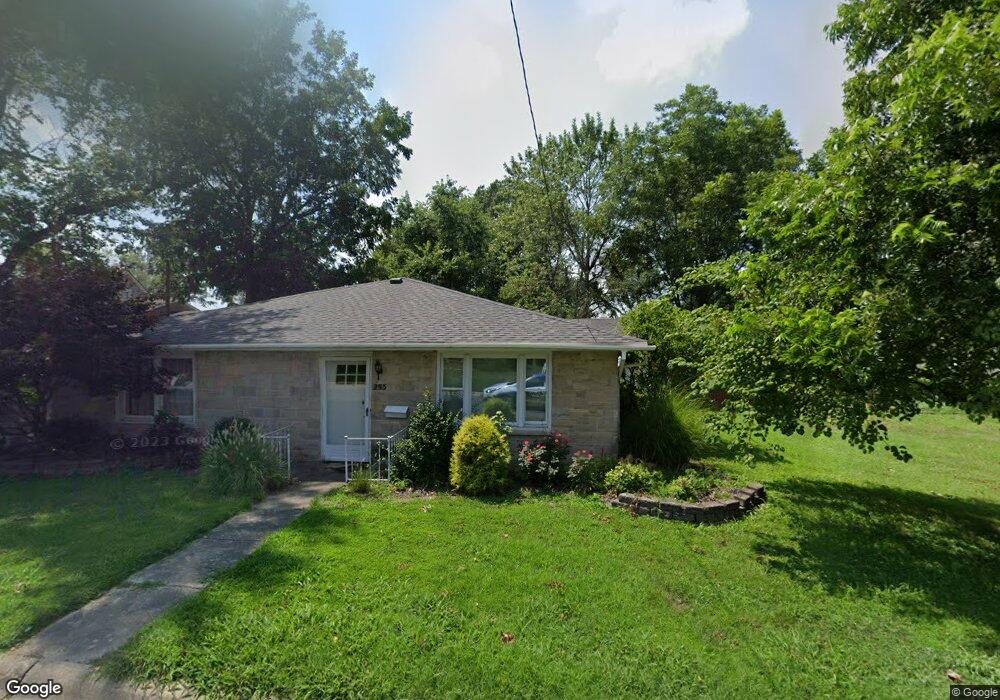
253 N Hoffman St Nashville, IL 62263
Estimated Value: $184,000 - $196,000
4
Beds
1
Bath
1,824
Sq Ft
$105/Sq Ft
Est. Value
About This Home
This home is located at 253 N Hoffman St, Nashville, IL 62263 and is currently estimated at $190,987, approximately $104 per square foot. 253 N Hoffman St is a home located in Washington County with nearby schools including Nashville Grade School, Nashville Community High School, and St. Ann School.
Ownership History
Date
Name
Owned For
Owner Type
Purchase Details
Closed on
Oct 6, 2023
Sold by
Polczynski Martha
Bought by
Haertling Leonard E
Current Estimated Value
Purchase Details
Closed on
Mar 8, 2023
Sold by
Haertling Leonard E
Bought by
Polczynski Martha
Create a Home Valuation Report for This Property
The Home Valuation Report is an in-depth analysis detailing your home's value as well as a comparison with similar homes in the area
Home Values in the Area
Average Home Value in this Area
Purchase History
| Date | Buyer | Sale Price | Title Company |
|---|---|---|---|
| Haertling Leonard E | -- | None Listed On Document | |
| Polczynski Martha | -- | None Listed On Document | |
| Haertling Leonard E | -- | -- |
Source: Public Records
Tax History Compared to Growth
Tax History
| Year | Tax Paid | Tax Assessment Tax Assessment Total Assessment is a certain percentage of the fair market value that is determined by local assessors to be the total taxable value of land and additions on the property. | Land | Improvement |
|---|---|---|---|---|
| 2024 | $2,621 | $47,169 | $3,434 | $43,735 |
| 2023 | $2,636 | $46,454 | $3,382 | $43,072 |
| 2022 | $2,701 | $44,555 | $3,692 | $40,863 |
| 2021 | $2,690 | $43,058 | $3,568 | $39,490 |
| 2020 | $2,747 | $42,402 | $3,513 | $38,889 |
| 2019 | $2,786 | $41,640 | $3,450 | $38,190 |
| 2018 | $2,788 | $41,920 | $4,110 | $37,810 |
| 2017 | $2,726 | $41,920 | $4,110 | $37,810 |
| 2016 | $2,761 | $41,920 | $4,110 | $37,810 |
| 2015 | $2,761 | $41,920 | $4,110 | $37,810 |
| 2014 | $2,631 | $41,920 | $4,110 | $37,810 |
| 2013 | $2,631 | $41,920 | $4,110 | $37,810 |
| 2012 | $2,690 | $41,920 | $4,110 | $37,810 |
Source: Public Records
Map
Nearby Homes
- 426 E Adams St
- 464 S Mill St
- 384 E Belleville St
- 163 W Walnut St
- 242 W 3rd St
- 8817 Reservoir Rd
- 509 W Saint Louis St
- 745 S Moore St
- 785 W Adams St
- Outlet 1 S Prairie St
- 593 W Hill St
- 977 W Saint Louis St
- Parcel 12 S Indian Grass Rd
- Parcel 3 S Indian Grass Rd
- Parcel 11 S Indian Grass Rd
- 4914 State Route 127
- 20621 County Highway 22
- 12 Hickory St
- 35 Hickory St
- 12497 Palm Tree Rd
- 250 N Hoffman St
- 665 E Elm St
- 642 E Walnut St
- 284 N Hoffman St
- 218 N Hoffman St
- 683 E Walnut St
- 308 N Hoffman St
- 616 E Walnut St
- 639 E Elm St
- 642 E Elm St
- 180 N Hoffman St
- 639 E Walnut St
- 609 E Elm St
- 617 E Walnut St
- 615 E Walnut St
- 266 N Hoffman St
- 583 E Elm St
- 612 E Elm St
- 360 N Hoffman St
- 140 N Hoffman St