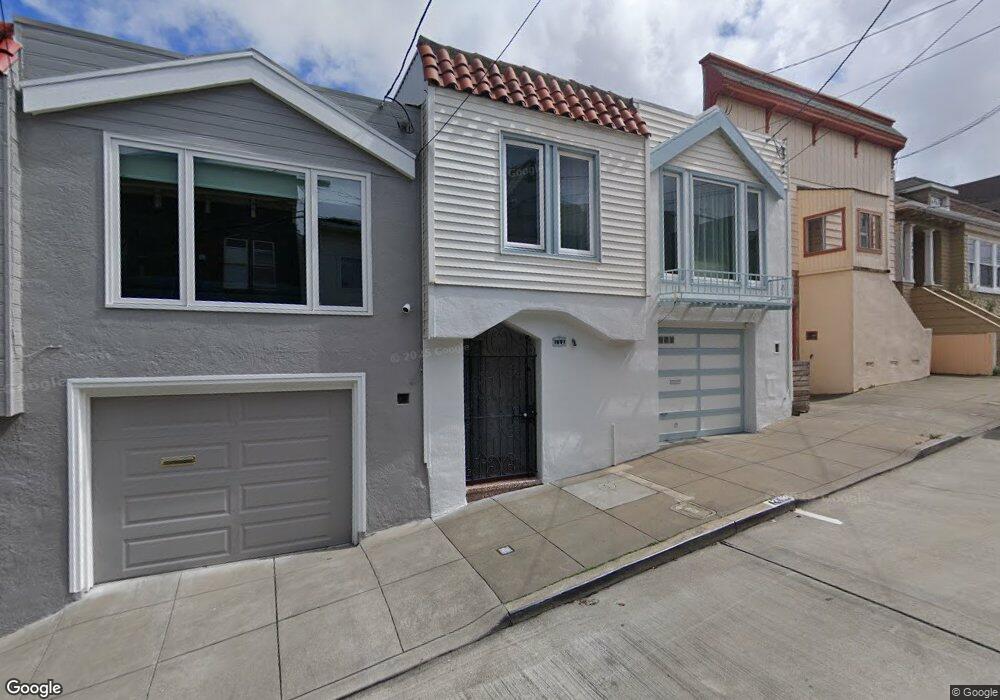
253 Nevada St San Francisco, CA 94110
Bernal Heights NeighborhoodEstimated Value: $1,002,000 - $1,443,000
2
Beds
1
Bath
1,012
Sq Ft
$1,149/Sq Ft
Est. Value
About This Home
This home is located at 253 Nevada St, San Francisco, CA 94110 and is currently estimated at $1,162,483, approximately $1,148 per square foot. 253 Nevada St is a home located in San Francisco County with nearby schools including Leonard R. Flynn Elementary, James Lick Middle School, and Donum Dei Classical Academy.
Ownership History
Date
Name
Owned For
Owner Type
Purchase Details
Closed on
Oct 6, 2021
Sold by
Sichel Kent H and Calm Waters Voyge Trust
Bought by
Sichel Kent H and Sichel Frances A
Current Estimated Value
Purchase Details
Closed on
May 11, 2021
Sold by
Sichel Kent H
Bought by
Sichel Kent H and Calm Waters Voyage Trust
Purchase Details
Closed on
Dec 4, 2020
Sold by
Sichel James W
Bought by
Sichel Kent H
Purchase Details
Closed on
Nov 18, 2019
Sold by
Sichel James W
Bought by
Sichel Kent Howard and Uchida Pamela Laraine
Purchase Details
Closed on
Jul 6, 1994
Sold by
Sichel Alice B
Bought by
Sichel Alice B and Sichel James W
Create a Home Valuation Report for This Property
The Home Valuation Report is an in-depth analysis detailing your home's value as well as a comparison with similar homes in the area
Home Values in the Area
Average Home Value in this Area
Purchase History
| Date | Buyer | Sale Price | Title Company |
|---|---|---|---|
| Sichel Kent H | -- | None Available | |
| Sichel Kent H | -- | None Available | |
| Sichel Kent H | -- | None Available | |
| Sichel Kent Howard | -- | None Available | |
| Sichel Alice B | -- | -- |
Source: Public Records
Tax History Compared to Growth
Tax History
| Year | Tax Paid | Tax Assessment Tax Assessment Total Assessment is a certain percentage of the fair market value that is determined by local assessors to be the total taxable value of land and additions on the property. | Land | Improvement |
|---|---|---|---|---|
| 2025 | $2,958 | $188,844 | $14,751 | $174,093 |
| 2024 | $2,958 | $185,143 | $14,462 | $170,681 |
| 2023 | $2,904 | $181,514 | $14,179 | $167,335 |
| 2022 | $2,832 | $177,955 | $13,901 | $164,054 |
| 2021 | $597 | $41,133 | $13,629 | $27,504 |
| 2020 | $515 | $40,712 | $13,490 | $27,222 |
| 2019 | $499 | $39,915 | $13,226 | $26,689 |
| 2018 | $485 | $39,133 | $12,967 | $26,166 |
| 2017 | $479 | $38,366 | $12,713 | $25,653 |
| 2016 | $440 | $37,614 | $12,464 | $25,150 |
| 2015 | $434 | $37,050 | $12,277 | $24,773 |
| 2014 | $423 | $36,325 | $12,037 | $24,288 |
Source: Public Records
Map
Nearby Homes