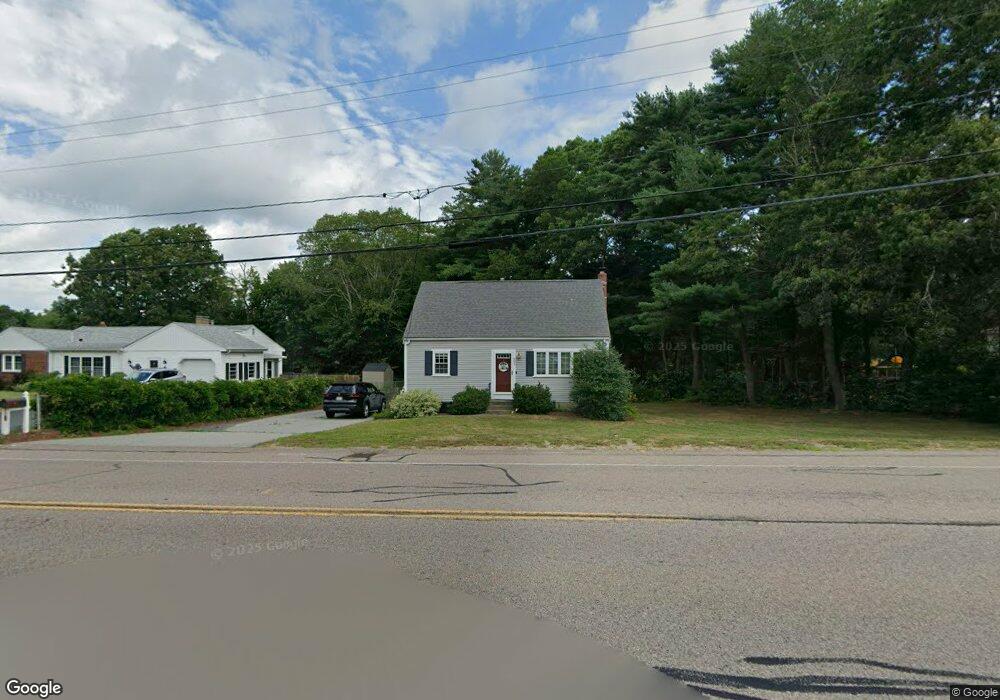
253 Pembroke St Kingston, MA 02364
Estimated Value: $469,000 - $583,000
3
Beds
2
Baths
1,267
Sq Ft
$421/Sq Ft
Est. Value
About This Home
This home is located at 253 Pembroke St, Kingston, MA 02364 and is currently estimated at $532,792, approximately $420 per square foot. 253 Pembroke St is a home located in Plymouth County with nearby schools including Silver Lake Regional High School, Kingston Elementary School, and Kingston Intermediate School.
Ownership History
Date
Name
Owned For
Owner Type
Purchase Details
Closed on
Jul 30, 2007
Sold by
Ricketts Karen F and Kent Karen F
Bought by
Sacco Patrick W and Mattson Melissa S
Current Estimated Value
Home Financials for this Owner
Home Financials are based on the most recent Mortgage that was taken out on this home.
Original Mortgage
$196,500
Interest Rate
6.78%
Mortgage Type
Purchase Money Mortgage
Create a Home Valuation Report for This Property
The Home Valuation Report is an in-depth analysis detailing your home's value as well as a comparison with similar homes in the area
Home Values in the Area
Average Home Value in this Area
Purchase History
| Date | Buyer | Sale Price | Title Company |
|---|---|---|---|
| Sacco Patrick W | $262,000 | -- |
Source: Public Records
Mortgage History
| Date | Status | Borrower | Loan Amount |
|---|---|---|---|
| Open | Sacco Patrick W | $255,000 | |
| Closed | Sacco Patrick W | $255,000 | |
| Closed | Sacco Patrick W | $196,500 |
Source: Public Records
Tax History Compared to Growth
Tax History
| Year | Tax Paid | Tax Assessment Tax Assessment Total Assessment is a certain percentage of the fair market value that is determined by local assessors to be the total taxable value of land and additions on the property. | Land | Improvement |
|---|---|---|---|---|
| 2025 | $5,992 | $462,000 | $192,900 | $269,100 |
| 2024 | $5,399 | $424,800 | $167,700 | $257,100 |
| 2023 | $5,197 | $389,000 | $167,700 | $221,300 |
| 2022 | $5,189 | $355,900 | $152,500 | $203,400 |
| 2021 | $4,911 | $305,400 | $140,400 | $165,000 |
| 2020 | $4,822 | $296,200 | $140,400 | $155,800 |
| 2019 | $4,665 | $283,400 | $140,400 | $143,000 |
| 2018 | $4,330 | $263,200 | $140,400 | $122,800 |
| 2017 | $4,095 | $248,200 | $136,300 | $111,900 |
| 2016 | $3,906 | $221,800 | $124,700 | $97,100 |
| 2015 | $3,728 | $220,100 | $124,700 | $95,400 |
| 2014 | $3,645 | $218,500 | $124,700 | $93,800 |
Source: Public Records
Map
Nearby Homes
- 255 Pembroke St
- 251 Pembroke St
- 11 Montclair Ave
- 257 Pembroke St
- 259 Pembroke St
- 12 Montclair Ave
- 7 Montclair Ave
- 10 Montclair Ave
- 249 Pembroke St
- 16 Brentwood Rd
- 20 Brentwood Rd
- 261 Pembroke St
- 18 Brentwood Rd
- 5 Montclair Ave
- 8 Montclair Ave
- 6 Montclair Ave
- 14 Brentwood Rd
- 265 Pembroke St
- 3 Montclair Ave
- 26 Brentwood Rd