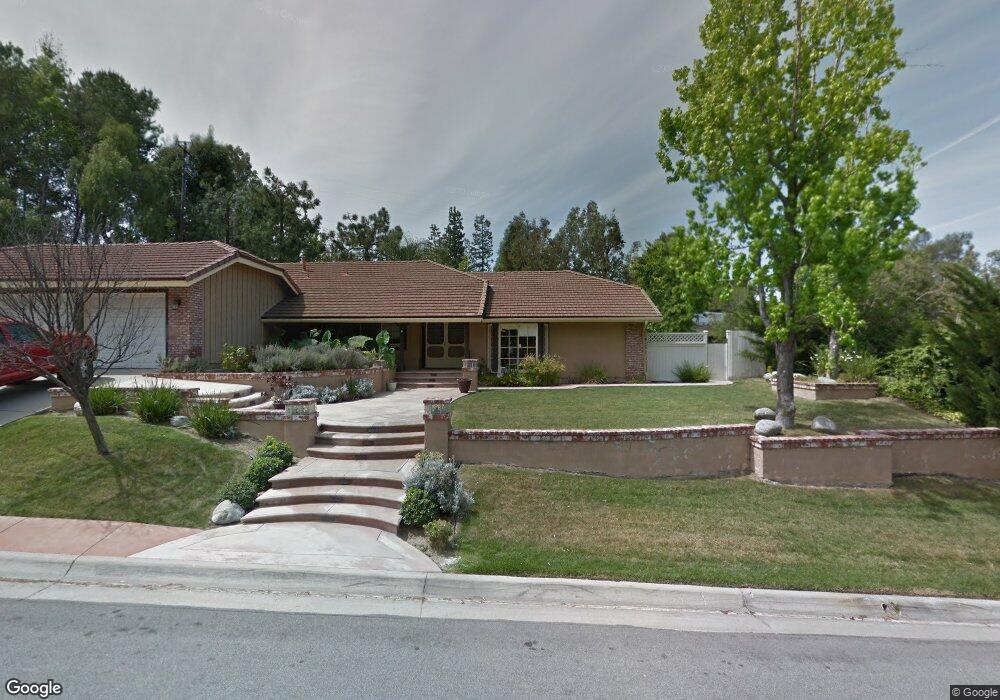
253 S Del Giorgio Rd Anaheim, CA 92808
Anaheim Hills NeighborhoodEstimated Value: $1,816,609 - $2,203,000
2
Beds
3
Baths
2,717
Sq Ft
$718/Sq Ft
Est. Value
About This Home
This home is located at 253 S Del Giorgio Rd, Anaheim, CA 92808 and is currently estimated at $1,951,402, approximately $718 per square foot. 253 S Del Giorgio Rd is a home located in Orange County with nearby schools including Crescent Elementary School, Canyon High School, and El Rancho Charter.
Ownership History
Date
Name
Owned For
Owner Type
Purchase Details
Closed on
Apr 5, 2022
Sold by
Thomas J And Elizabeth A Conway Family T
Bought by
Oconnell William R
Current Estimated Value
Home Financials for this Owner
Home Financials are based on the most recent Mortgage that was taken out on this home.
Original Mortgage
$800,000
Interest Rate
3.5%
Mortgage Type
New Conventional
Purchase Details
Closed on
Oct 18, 2019
Sold by
Conway Thomas J and Conway Elizabeth A
Bought by
Conway Thomas J and Conway Elizabeth
Purchase Details
Closed on
Oct 15, 2019
Sold by
Fisher Patricia K
Bought by
Conway Thomas J and Conway Elizabeth A
Purchase Details
Closed on
Mar 27, 2013
Sold by
Fisher Patricia K
Bought by
Fisher Patricia K and The John W & Patricia K Fisher Survivors
Purchase Details
Closed on
Jul 3, 2003
Sold by
Fisher Patricia K
Bought by
Fisher Patricia K
Home Financials for this Owner
Home Financials are based on the most recent Mortgage that was taken out on this home.
Original Mortgage
$454,000
Interest Rate
5.22%
Mortgage Type
Purchase Money Mortgage
Purchase Details
Closed on
Sep 30, 2002
Sold by
Fisher Patricia
Bought by
Fisher Patricia K and John W & Patricia K Fisher Survivors Tr
Create a Home Valuation Report for This Property
The Home Valuation Report is an in-depth analysis detailing your home's value as well as a comparison with similar homes in the area
Home Values in the Area
Average Home Value in this Area
Purchase History
| Date | Buyer | Sale Price | Title Company |
|---|---|---|---|
| Oconnell William R | $1,600,000 | Progressive Title | |
| Conway Thomas J | -- | None Available | |
| Conway Thomas J | -- | None Available | |
| Fisher Patricia K | -- | None Available | |
| Fisher Patricia K | -- | First American Title Co | |
| Fisher Patricia K | -- | -- |
Source: Public Records
Mortgage History
| Date | Status | Borrower | Loan Amount |
|---|---|---|---|
| Previous Owner | Oconnell William R | $800,000 | |
| Previous Owner | Fisher Patricia K | $454,000 |
Source: Public Records
Tax History Compared to Growth
Tax History
| Year | Tax Paid | Tax Assessment Tax Assessment Total Assessment is a certain percentage of the fair market value that is determined by local assessors to be the total taxable value of land and additions on the property. | Land | Improvement |
|---|---|---|---|---|
| 2025 | $17,564 | $1,664,640 | $1,186,911 | $477,729 |
| 2024 | $17,564 | $1,632,000 | $1,163,638 | $468,362 |
| 2023 | $17,182 | $1,600,000 | $1,140,821 | $459,179 |
| 2022 | $7,752 | $739,821 | $354,990 | $384,831 |
| 2021 | $7,527 | $725,315 | $348,029 | $377,286 |
| 2020 | $7,458 | $717,878 | $344,460 | $373,418 |
| 2019 | $7,358 | $703,802 | $337,705 | $366,097 |
| 2018 | $7,243 | $690,002 | $331,083 | $358,919 |
| 2017 | $6,929 | $676,473 | $324,591 | $351,882 |
| 2016 | $6,790 | $663,209 | $318,226 | $344,983 |
| 2015 | $6,702 | $653,247 | $313,445 | $339,802 |
| 2014 | $6,558 | $640,451 | $307,305 | $333,146 |
Source: Public Records
Map
Nearby Homes
- 157 S Donna Ct
- 7350 E Calle Durango
- 7583 E Country Hill Ln
- 7580 E Martella Ln
- 309 S Penny Ln
- 316 S Penny Ln
- 312 S Penny Ln
- 7653 E Corto Rd
- 6587 E Via Arboles
- 185 S Trish Ct
- 414 S Cooks Corner
- 6554 E Via Estrada
- 7715 E Camino Tampico
- 6189 E Camino Manzano
- 242 N Camino Arroyo
- 712 S Lost Canyon Rd
- 397 S San Vicente Ln Unit 31
- 7572 E Endemont Ct
- 719 S Goldfinch Way
- 131 S Francisco St
- 263 S Del Giorgio Rd
- 283 S Del Giorgio Rd
- 281 S Old Bridge Rd
- 291 S Old Bridge Rd
- 243 S Del Giorgio Rd
- 273 S Del Giorgio Rd
- 271 S Old Bridge Rd
- 301 S Old Bridge Rd
- 293 S Del Giorgio Rd
- 311 S Old Bridge Rd
- 223 S Del Giorgio Rd
- 261 S Old Bridge Rd
- 260 S Old Bridge Rd
- 260 S Willowcreek Ln
- 270 S Old Bridge Rd
- 7301 E Stone Creek Ln
- 321 S Old Bridge Rd
- 250 S Willowcreek Ln
- 270 S Willowcreek Ln
- 251 S Old Bridge Rd