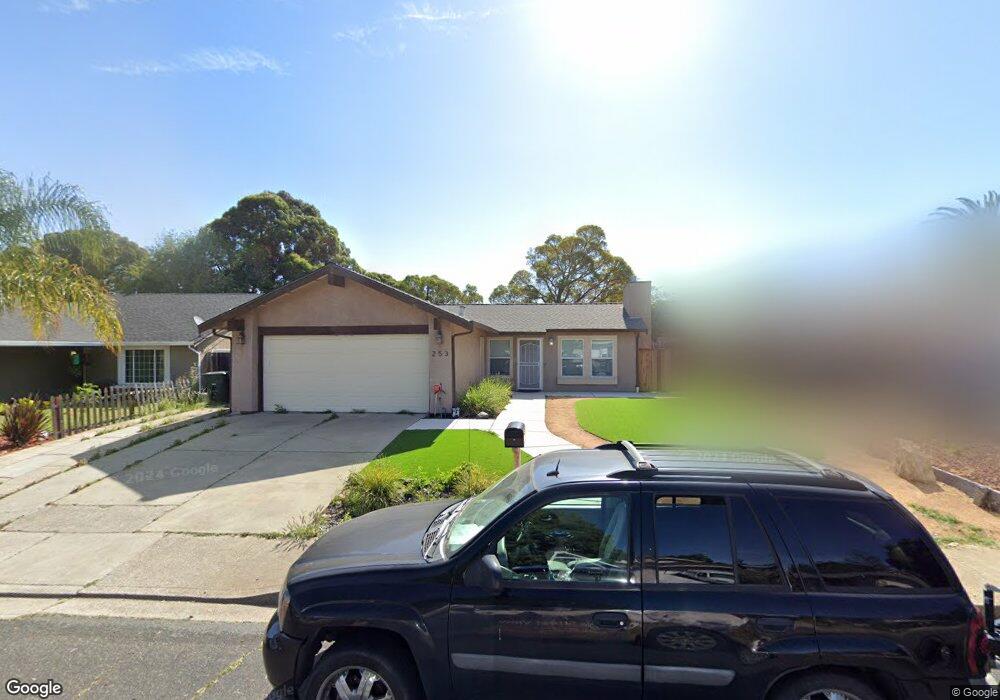
253 Spinnaker Way Pittsburg, CA 94565
Woodland Hills NeighborhoodEstimated Value: $522,000 - $576,000
3
Beds
1
Bath
1,400
Sq Ft
$395/Sq Ft
Est. Value
About This Home
This home is located at 253 Spinnaker Way, Pittsburg, CA 94565 and is currently estimated at $552,688, approximately $394 per square foot. 253 Spinnaker Way is a home located in Contra Costa County with nearby schools including Willow Cove Elementary School, Rancho Medanos Junior High School, and Pittsburg Senior High School.
Ownership History
Date
Name
Owned For
Owner Type
Purchase Details
Closed on
Jun 1, 2021
Sold by
Cazares Adolfo
Bought by
Cazares Adolfo and Carranza Maribel Arreguin
Current Estimated Value
Purchase Details
Closed on
Oct 6, 2015
Sold by
Holmes Robert and Holmes Priyanka
Bought by
Cazares Adolfo
Home Financials for this Owner
Home Financials are based on the most recent Mortgage that was taken out on this home.
Original Mortgage
$288,664
Outstanding Balance
$226,344
Interest Rate
3.78%
Mortgage Type
FHA
Estimated Equity
$326,344
Purchase Details
Closed on
Oct 18, 2013
Sold by
Balley Vinod K and Balley Lajya D
Bought by
Federal National Mortgage Association
Purchase Details
Closed on
Jan 20, 2013
Sold by
Federal National Mortgage Association
Bought by
Holmes Robert and Holmes Priyanka
Home Financials for this Owner
Home Financials are based on the most recent Mortgage that was taken out on this home.
Original Mortgage
$192,000
Interest Rate
4.4%
Mortgage Type
New Conventional
Create a Home Valuation Report for This Property
The Home Valuation Report is an in-depth analysis detailing your home's value as well as a comparison with similar homes in the area
Home Values in the Area
Average Home Value in this Area
Purchase History
| Date | Buyer | Sale Price | Title Company |
|---|---|---|---|
| Cazares Adolfo | -- | Old Republic Title Company | |
| Cazares Adolfo | $294,000 | First American Title Company | |
| Cazares Adolfo | -- | First American Title Company | |
| Federal National Mortgage Association | $244,024 | Accommodation | |
| Holmes Robert | $240,000 | Servicelink |
Source: Public Records
Mortgage History
| Date | Status | Borrower | Loan Amount |
|---|---|---|---|
| Open | Cazares Adolfo | $288,664 | |
| Previous Owner | Holmes Robert | $192,000 |
Source: Public Records
Tax History
| Year | Tax Paid | Tax Assessment Tax Assessment Total Assessment is a certain percentage of the fair market value that is determined by local assessors to be the total taxable value of land and additions on the property. | Land | Improvement |
|---|---|---|---|---|
| 2025 | $5,426 | $390,476 | $208,462 | $182,014 |
| 2024 | $5,397 | $382,821 | $204,375 | $178,446 |
| 2023 | $5,397 | $375,316 | $200,368 | $174,948 |
| 2022 | $4,548 | $327,958 | $196,440 | $131,518 |
| 2021 | $4,550 | $321,529 | $192,589 | $128,940 |
| 2019 | $4,338 | $311,994 | $186,878 | $125,116 |
| 2018 | $4,176 | $305,877 | $183,214 | $122,663 |
| 2017 | $4,150 | $299,880 | $179,622 | $120,258 |
| 2016 | $3,881 | $294,000 | $176,100 | $117,900 |
| 2015 | $3,499 | $244,795 | $101,998 | $142,797 |
| 2014 | $3,499 | $175,000 | $70,000 | $105,000 |
Source: Public Records
Map
Nearby Homes
- 148 Spinnaker Way
- 229 E Catamaran Cir
- 2121 Apricot Ct
- 343 Bernauer
- 742 Wedgewood Dr
- 1526 Willow Pass Rd Unit 42
- 1526 Willow Pass Rd Unit 16
- 2132 Misty Ct
- 113 Loftus Rd
- 168 Loftus Rd
- 346 Melanie Dr
- 24 Mountain View Ave
- 191 Maureen Cir
- 0 Mountain View Ave
- 68 - 76 Bayview Ave
- 3142 Cortina Dr
- 101 Atherton Cir
- 79 Bella Vista Ave
- 2171 Rain Drop Cir
- 179 Crivello Ave
- 245 Spinnaker Way
- 261 Spinnaker Way
- 237 Spinnaker Way
- 269 Spinnaker Way
- 196 Spinnaker Way
- 204 Spinnaker Way
- 188 Spinnaker Way
- 229 Spinnaker Way
- 180 Northstar Dr
- 277 Spinnaker Way
- 169 Sealane Ct
- 180 Sealane Ct
- 180 Spinnaker Way
- 170 Northstar Dr
- 221 Spinnaker Way
- 3 Spinnaker Ct
- 10 Bora Place
- 372 Morningstar Ct
- 12 Bora Place
- 2 Spinnaker Ct
Your Personal Tour Guide
Ask me questions while you tour the home.