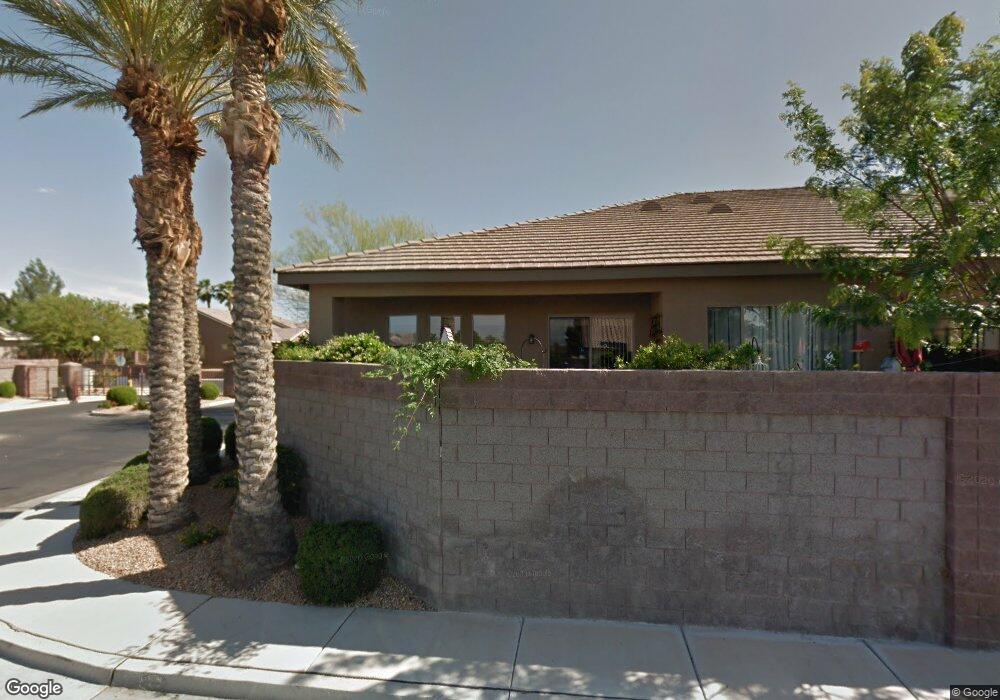
253 Spring River Ave Unit 5 Las Vegas, NV 89123
Silverado Ranch NeighborhoodEstimated Value: $391,778 - $424,000
3
Beds
2
Baths
1,557
Sq Ft
$261/Sq Ft
Est. Value
About This Home
This home is located at 253 Spring River Ave Unit 5, Las Vegas, NV 89123 and is currently estimated at $406,445, approximately $261 per square foot. 253 Spring River Ave Unit 5 is a home located in Clark County with nearby schools including John R. Hummel Elementary School, Charles Silvestri Junior High School, and Liberty High School.
Ownership History
Date
Name
Owned For
Owner Type
Purchase Details
Closed on
Mar 24, 2004
Sold by
Manning Joseph R and Wait Christine
Bought by
Scholer Duane
Current Estimated Value
Home Financials for this Owner
Home Financials are based on the most recent Mortgage that was taken out on this home.
Original Mortgage
$162,000
Outstanding Balance
$73,807
Interest Rate
5.64%
Mortgage Type
Unknown
Estimated Equity
$332,638
Purchase Details
Closed on
May 5, 2000
Sold by
Duck Creek Landing Llc
Bought by
Manning Joseph R and Wait Christine
Home Financials for this Owner
Home Financials are based on the most recent Mortgage that was taken out on this home.
Original Mortgage
$114,700
Interest Rate
8.22%
Create a Home Valuation Report for This Property
The Home Valuation Report is an in-depth analysis detailing your home's value as well as a comparison with similar homes in the area
Home Values in the Area
Average Home Value in this Area
Purchase History
| Date | Buyer | Sale Price | Title Company |
|---|---|---|---|
| Scholer Duane | $207,000 | Ticor Title Of Nevada Inc | |
| Manning Joseph R | $143,400 | Nevada Title Company |
Source: Public Records
Mortgage History
| Date | Status | Borrower | Loan Amount |
|---|---|---|---|
| Open | Scholer Duane | $162,000 | |
| Previous Owner | Manning Joseph R | $114,700 |
Source: Public Records
Tax History
| Year | Tax Paid | Tax Assessment Tax Assessment Total Assessment is a certain percentage of the fair market value that is determined by local assessors to be the total taxable value of land and additions on the property. | Land | Improvement |
|---|---|---|---|---|
| 2026 | $2,408 | $99,561 | $36,400 | $63,161 |
| 2025 | $2,230 | $99,348 | $36,050 | $63,298 |
| 2024 | $2,065 | $99,348 | $36,050 | $63,298 |
| 2023 | $2,065 | $86,256 | $28,350 | $57,906 |
| 2022 | $1,912 | $80,843 | $25,900 | $54,943 |
| 2021 | $1,771 | $69,316 | $24,150 | $45,166 |
| 2020 | $1,642 | $70,162 | $23,100 | $47,062 |
| 2019 | $1,538 | $67,738 | $21,000 | $46,738 |
| 2018 | $1,468 | $61,310 | $16,450 | $44,860 |
| 2017 | $1,375 | $59,623 | $15,050 | $44,573 |
| 2016 | $1,375 | $57,436 | $11,900 | $45,536 |
| 2015 | $1,371 | $45,849 | $8,750 | $37,099 |
| 2014 | $1,331 | $43,720 | $7,000 | $36,720 |
Source: Public Records
Map
Nearby Homes
- 252 Spring River Ave
- 242 Kyland Cove Ave
- 282 Spring River Ave
- 9113 Black Slate St
- 9152 Aqueduct St
- 156 Staten Island Ave Unit 4
- 9077 Glasbury Ct
- 9200 Penn Station St
- 9194 Penn Station St
- 9548 Windsor Forest Ct
- 319 Barletta Ave
- 67 E Agate Ave Unit 408
- 9565 Vital Crest St
- 55 E Agate Ave Unit 507
- 51 E Agate Ave Unit 507
- 9210 Camden Heights Ct
- 50 E Serene Ave Unit 105
- 50 E Serene Ave Unit 320
- 23 E Agate Ave Unit 403
- 39 E Agate Ave Unit 208
- 249 Spring River Ave Unit 9
- 245 Spring River Ave
- 254 Kyland Cove Ave
- 250 Kyland Cove Ave
- 9254 Drifting Bay St
- 9260 Drifting Bay St
- 246 Kyland Cove Ave
- 241 Spring River Ave
- 9266 Drifting Bay St
- 248 Spring River Ave
- 244 Spring River Ave
- 9272 Drifting Bay St
- 237 Spring River Ave Unit 9
- 237 Spring River Ave
- 258 Spring River Ave
- 238 Kyland Cove Ave
- 240 Spring River Ave Unit 9
- 233 Spring River Ave
- 262 Spring River Ave
- 266 Kyland Cove Ave
Your Personal Tour Guide
Ask me questions while you tour the home.