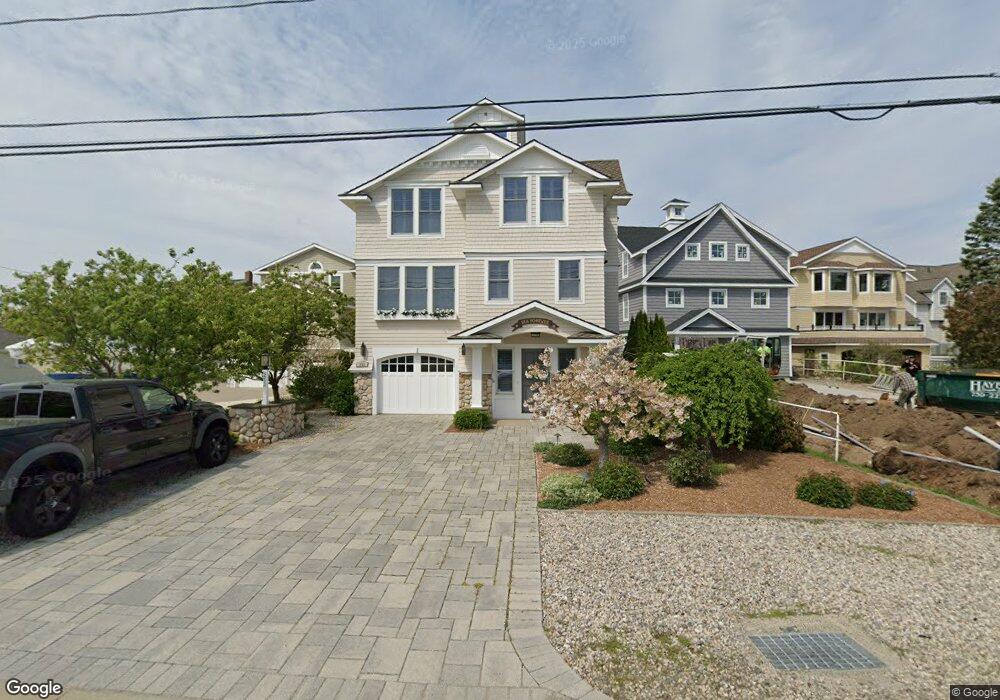
253 W Shore Ave Groton, CT 06340
Estimated Value: $2,163,000 - $2,302,000
4
Beds
8
Baths
2,448
Sq Ft
$913/Sq Ft
Est. Value
About This Home
This home is located at 253 W Shore Ave, Groton, CT 06340 and is currently estimated at $2,234,746, approximately $912 per square foot. 253 W Shore Ave is a home located in New London County with nearby schools including Groton Middle School and Robert E. Fitch High School.
Ownership History
Date
Name
Owned For
Owner Type
Purchase Details
Closed on
May 28, 2025
Sold by
Gorton James C and Gorton Antonia B
Bought by
Gorton James C
Current Estimated Value
Purchase Details
Closed on
Nov 21, 2008
Sold by
Labbe Donna M
Bought by
Groton James G and Groton Antonia B
Home Financials for this Owner
Home Financials are based on the most recent Mortgage that was taken out on this home.
Original Mortgage
$1,412,550
Interest Rate
6.03%
Purchase Details
Closed on
Apr 1, 2002
Sold by
Disanto Paul E and Disanto Carol
Bought by
Labbe Donna M
Purchase Details
Closed on
Jun 1, 2000
Sold by
Amodio Jayne M and Amodio-Norman Debra
Bought by
Disanto Carol A and Disanto Paul E
Create a Home Valuation Report for This Property
The Home Valuation Report is an in-depth analysis detailing your home's value as well as a comparison with similar homes in the area
Home Values in the Area
Average Home Value in this Area
Purchase History
| Date | Buyer | Sale Price | Title Company |
|---|---|---|---|
| Gorton James C | -- | None Available | |
| Gorton James C | -- | None Available | |
| Groton James G | $1,602,000 | -- | |
| Groton James G | $1,602,000 | -- | |
| Labbe Donna M | $800,000 | -- | |
| Labbe Donna M | $800,000 | -- | |
| Disanto Carol A | $698,000 | -- | |
| Disanto Carol A | $698,000 | -- |
Source: Public Records
Mortgage History
| Date | Status | Borrower | Loan Amount |
|---|---|---|---|
| Previous Owner | Disanto Carol A | $1,428,000 | |
| Previous Owner | Disanto Carol A | $1,412,550 |
Source: Public Records
Tax History Compared to Growth
Tax History
| Year | Tax Paid | Tax Assessment Tax Assessment Total Assessment is a certain percentage of the fair market value that is determined by local assessors to be the total taxable value of land and additions on the property. | Land | Improvement |
|---|---|---|---|---|
| 2025 | $37,121 | $1,317,750 | $894,782 | $422,968 |
| 2024 | $34,841 | $1,317,750 | $894,782 | $422,968 |
| 2023 | $33,589 | $1,317,750 | $713,510 | $604,240 |
| 2022 | $32,957 | $1,317,750 | $713,510 | $604,240 |
| 2021 | $26,580 | $882,770 | $461,860 | $420,910 |
| 2020 | $26,189 | $882,770 | $461,860 | $420,910 |
| 2019 | $25,112 | $882,770 | $461,860 | $420,910 |
| 2018 | $24,612 | $882,770 | $461,860 | $420,910 |
| 2017 | $24,078 | $881,020 | $461,860 | $419,160 |
| 2016 | $28,653 | $1,158,920 | $630,000 | $528,920 |
| 2015 | $26,163 | $1,092,630 | $630,000 | $462,630 |
| 2014 | $25,322 | $1,092,630 | $630,000 | $462,630 |
Source: Public Records
Map
Nearby Homes