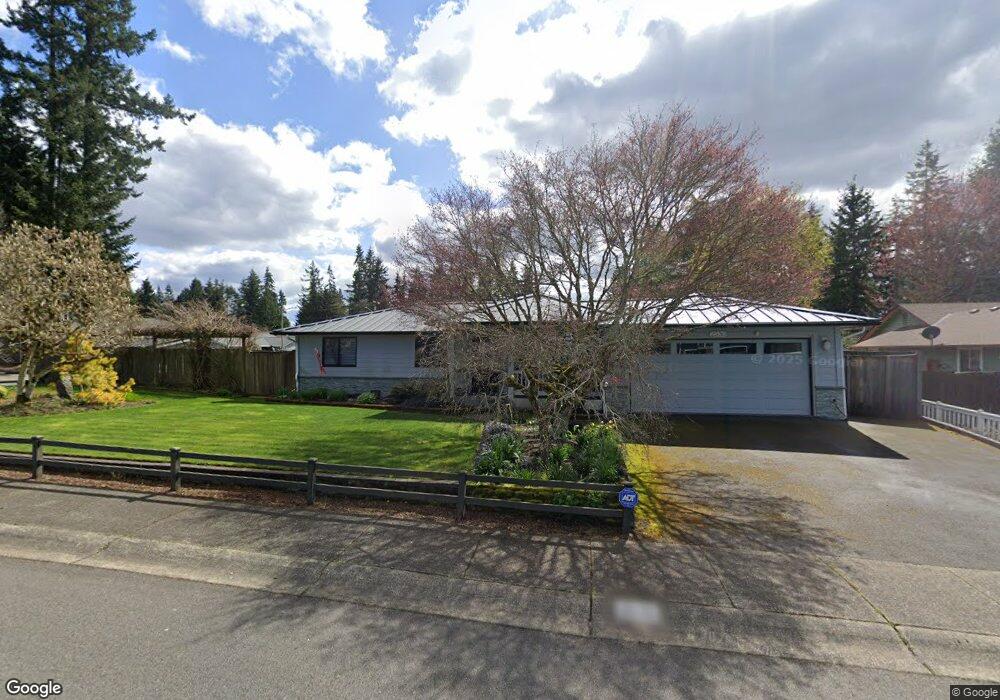
2530 167th Place SE Bothell, WA 98012
North Creek NeighborhoodEstimated Value: $773,000 - $865,000
3
Beds
2
Baths
1,258
Sq Ft
$641/Sq Ft
Est. Value
About This Home
This home is located at 2530 167th Place SE, Bothell, WA 98012 and is currently estimated at $806,032, approximately $640 per square foot. 2530 167th Place SE is a home located in Snohomish County with nearby schools including Woodside Elementary School, Heatherwood Middle School, and Henry M. Jackson High School.
Ownership History
Date
Name
Owned For
Owner Type
Purchase Details
Closed on
Apr 30, 2012
Sold by
Tyler Dennis W
Bought by
Tyler Dennis W and Tyler Margaret A
Current Estimated Value
Purchase Details
Closed on
Apr 22, 2003
Sold by
Waldo Joshua C and Waldo Malina A
Bought by
Tyler Dennis W
Home Financials for this Owner
Home Financials are based on the most recent Mortgage that was taken out on this home.
Original Mortgage
$226,736
Outstanding Balance
$95,901
Interest Rate
5.54%
Mortgage Type
FHA
Estimated Equity
$710,131
Purchase Details
Closed on
Aug 2, 2000
Sold by
Wong Leila Anderson
Bought by
Waldo Joshua C and Waldo Malina A
Home Financials for this Owner
Home Financials are based on the most recent Mortgage that was taken out on this home.
Original Mortgage
$192,050
Interest Rate
8.12%
Purchase Details
Closed on
Jul 28, 1998
Sold by
Wong Vernon and Wong Catherine
Bought by
Wong Leila Anderson
Create a Home Valuation Report for This Property
The Home Valuation Report is an in-depth analysis detailing your home's value as well as a comparison with similar homes in the area
Home Values in the Area
Average Home Value in this Area
Purchase History
| Date | Buyer | Sale Price | Title Company |
|---|---|---|---|
| Tyler Dennis W | -- | None Available | |
| Tyler Dennis W | $229,940 | Pnwt | |
| Waldo Joshua C | $198,000 | Washington Title Company | |
| Wong Leila Anderson | $125,000 | -- |
Source: Public Records
Mortgage History
| Date | Status | Borrower | Loan Amount |
|---|---|---|---|
| Open | Tyler Dennis W | $226,736 | |
| Previous Owner | Waldo Joshua C | $192,050 |
Source: Public Records
Tax History Compared to Growth
Tax History
| Year | Tax Paid | Tax Assessment Tax Assessment Total Assessment is a certain percentage of the fair market value that is determined by local assessors to be the total taxable value of land and additions on the property. | Land | Improvement |
|---|---|---|---|---|
| 2025 | $6,735 | $744,300 | $485,000 | $259,300 |
| 2024 | $6,735 | $699,300 | $440,000 | $259,300 |
| 2023 | $6,767 | $770,100 | $515,000 | $255,100 |
| 2022 | $5,815 | $572,300 | $356,000 | $216,300 |
| 2020 | $5,581 | $461,600 | $285,000 | $176,600 |
| 2019 | $5,058 | $419,100 | $255,000 | $164,100 |
| 2018 | $5,067 | $382,700 | $220,000 | $162,700 |
| 2017 | $4,441 | $337,300 | $185,000 | $152,300 |
| 2016 | $3,891 | $310,000 | $162,000 | $148,000 |
| 2015 | $3,887 | $293,700 | $155,000 | $138,700 |
| 2013 | $3,247 | $216,200 | $118,000 | $98,200 |
Source: Public Records
Map
Nearby Homes
- 3410 165th St SE
- 16606 35th Ave SE Unit 9A
- KIMBALL Plan at Tambark Estates
- 16008 30th Dr SE
- 2015 Mill Pointe Dr SE
- 15901 30th Dr SE
- 16119 35th Dr SE
- 2400 177th St SE
- 1621 Seattle Hill Rd Unit Q2
- 3701 170th Place SE
- 5 xx 158th St SE
- 16519 37th Dr SE
- 2120 178th St SE
- 1325 Seattle Hill Rd Unit A2
- 18008 25th Dr SE
- 1616 175th Place SE
- 3205 179th Place SE
- 16910 40th Ave SE
- 17824 19th Ave SE
- 16101 Bothell Everett Hwy Unit J3
- 16724 26th Ave SE
- 2522 167th Place SE
- 2531 167th Place SE
- 16728 26th Ave SE
- 16715 26th Ave SE
- 2521 167th Place SE
- 2523 168th St SE
- 2514 167th Place SE
- 16723 26th Ave SE
- 16707 26th Ave SE
- 16631 26th Ave SE
- 2515 168th St SE
- 16729 26th Ave SE
- 16624 26th Ave SE
- 2513 167th Place SE
- 2704 167th St SE
- 16625 26th Ave SE
- 2508 167th Place SE
- 2504 167th Place SE Unit 2
- 2504 167th Place SE