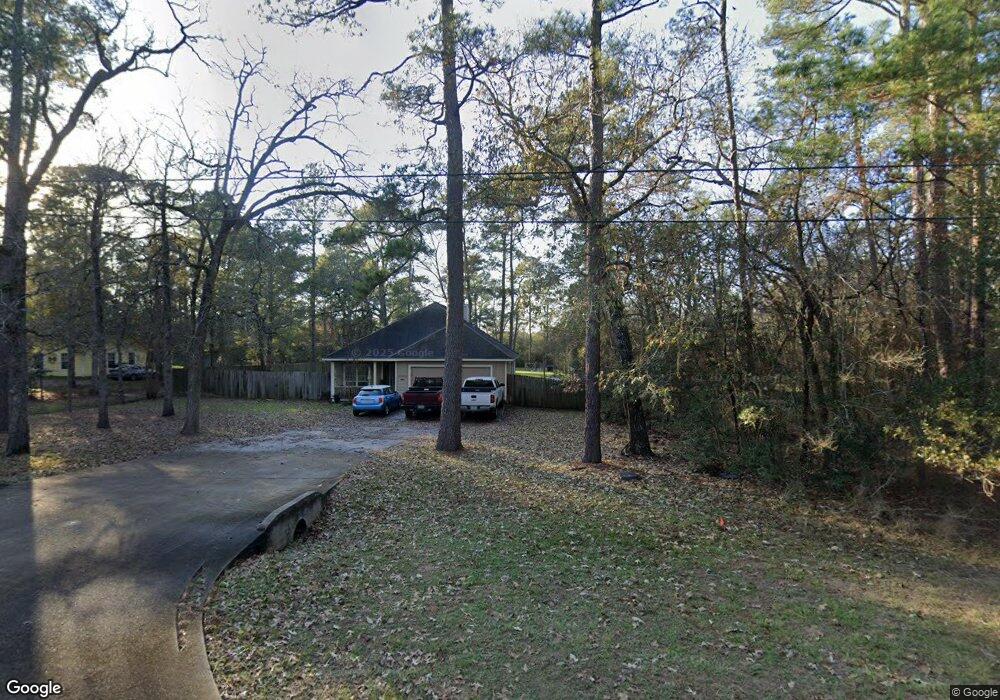
25303 Penguin St Magnolia, TX 77355
Clear Creek Forest NeighborhoodEstimated Value: $378,000 - $427,000
3
Beds
2
Baths
1,678
Sq Ft
$237/Sq Ft
Est. Value
About This Home
This home is located at 25303 Penguin St, Magnolia, TX 77355 and is currently estimated at $397,890, approximately $237 per square foot. 25303 Penguin St is a home located in Montgomery County with nearby schools including J.L. Lyon Elementary School, Magnolia Sixth Grade Campus, and Magnolia Junior High School.
Ownership History
Date
Name
Owned For
Owner Type
Purchase Details
Closed on
Apr 11, 2006
Sold by
Thomas & Jones Homes Inc
Bought by
Jenkins Charles H
Current Estimated Value
Home Financials for this Owner
Home Financials are based on the most recent Mortgage that was taken out on this home.
Original Mortgage
$142,396
Outstanding Balance
$81,167
Interest Rate
6.22%
Mortgage Type
Fannie Mae Freddie Mac
Estimated Equity
$316,723
Purchase Details
Closed on
Nov 19, 2004
Sold by
Jim Walter Homes Inc
Bought by
Thomas & Jones Homes Inc
Purchase Details
Closed on
Mar 26, 2002
Sold by
Mitchell Mtg Company Llc
Bought by
Neatherlin Homes Inc
Purchase Details
Closed on
Aug 18, 1998
Sold by
Mitchell Resorts Inc
Bought by
Mitchell Mtg Company Llc
Purchase Details
Closed on
Dec 5, 1995
Sold by
Marquette Michael T and Marquette Chun Mien
Bought by
Mitchell and Southwest
Purchase Details
Closed on
Jul 13, 1991
Sold by
Mitchell Resorts Inc
Bought by
Jenkins Charles H and Jenkins Kristina
Create a Home Valuation Report for This Property
The Home Valuation Report is an in-depth analysis detailing your home's value as well as a comparison with similar homes in the area
Home Values in the Area
Average Home Value in this Area
Purchase History
| Date | Buyer | Sale Price | Title Company |
|---|---|---|---|
| Jenkins Charles H | -- | Stewart Title | |
| Thomas & Jones Homes Inc | -- | -- | |
| Neatherlin Homes Inc | -- | Texas American Title Company | |
| Mitchell Mtg Company Llc | -- | -- | |
| Mitchell | $4,550 | -- | |
| Jenkins Charles H | -- | -- |
Source: Public Records
Mortgage History
| Date | Status | Borrower | Loan Amount |
|---|---|---|---|
| Open | Jenkins Charles H | $142,396 |
Source: Public Records
Tax History Compared to Growth
Tax History
| Year | Tax Paid | Tax Assessment Tax Assessment Total Assessment is a certain percentage of the fair market value that is determined by local assessors to be the total taxable value of land and additions on the property. | Land | Improvement |
|---|---|---|---|---|
| 2025 | $5,283 | $343,686 | $59,491 | $284,195 |
| 2024 | $3,518 | $333,693 | $59,491 | $274,202 |
| 2023 | $3,518 | $301,580 | $59,490 | $265,650 |
| 2022 | $4,838 | $274,160 | $78,530 | $246,800 |
| 2021 | $4,633 | $249,240 | $59,490 | $189,750 |
| 2020 | $4,671 | $230,790 | $59,490 | $171,300 |
| 2019 | $4,471 | $222,000 | $59,490 | $162,510 |
| 2018 | $3,804 | $206,830 | $30,340 | $176,490 |
| 2017 | $4,465 | $210,550 | $30,340 | $180,210 |
| 2016 | $4,185 | $197,360 | $30,340 | $167,020 |
| 2015 | $3,490 | $189,960 | $30,340 | $161,530 |
| 2014 | $3,490 | $172,690 | $7,870 | $164,820 |
Source: Public Records
Map
Nearby Homes
- 22920 Blackgum Dr
- 30103 Thousand Oaks Ct
- 22922 Blackgum Dr
- 25402 Holly Oaks Ct
- 22806 Lantana Dr
- 20127 Sapphire Cir
- 25903 Penguin St
- 22710 Meadowsweet Dr
- 30311 N Holly Oaks Cir
- 30003 Desert Willow Ct
- 20002 Sapphire Cir
- 25103 Lake Park Ct
- 22219 Rainfern Dr
- 22403 Meadowsweet Dr
- 0 Baneberry
- 28126 Walnut Creek Ct
- 22102 Badger Hollow Dr
- 20626 Imperial Oak Dr
- 27141 Nichols Sawmill Rd
- 289 Pelican St
- 25215 Penguin St
- 25311 Penguin St
- 25211 Penguin St
- 25315 Penguin St
- 25314 Penguin St
- 25207 Penguin St
- 25319 Penguin St
- 26415 Penguin St
- 25402 Penguin St
- 25203 Penguin St
- 26411 Penguin St
- 25403 Penguin St
- 25318 Penguin St
- 25410 Penguin St
- 26403 Penguin St
- 25111 Penguin St
- 26406 Penguin St
- 25415 Penguin St
- 25419 Penguin St
- 26315 Penguin St