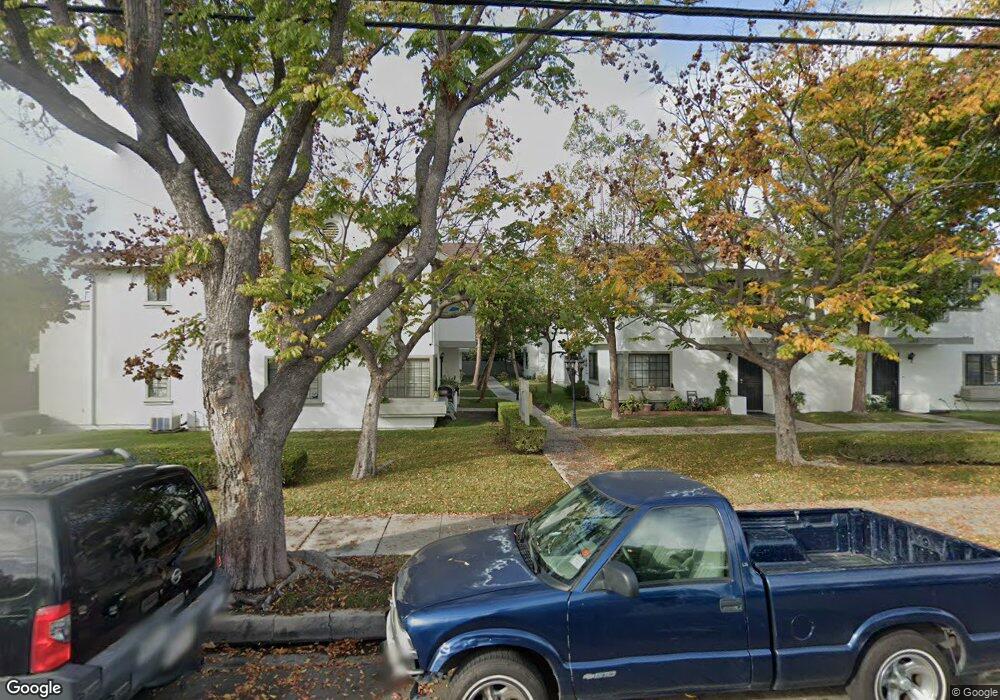
2531 California Ave Unit 5 Signal Hill, CA 90755
Estimated Value: $561,572 - $617,000
2
Beds
3
Baths
1,222
Sq Ft
$475/Sq Ft
Est. Value
About This Home
This home is located at 2531 California Ave Unit 5, Signal Hill, CA 90755 and is currently estimated at $580,893, approximately $475 per square foot. 2531 California Ave Unit 5 is a home located in Los Angeles County with nearby schools including Signal Hill Elementary School, Nelson Academy, and Long Beach Polytechnic High School.
Ownership History
Date
Name
Owned For
Owner Type
Purchase Details
Closed on
Oct 2, 2001
Sold by
Penn Lemont E
Bought by
Spears Penn Velma M
Current Estimated Value
Home Financials for this Owner
Home Financials are based on the most recent Mortgage that was taken out on this home.
Original Mortgage
$151,800
Interest Rate
6.73%
Purchase Details
Closed on
Aug 29, 2001
Sold by
Shat Enterprises Llc
Bought by
Spears Penn Velma M
Home Financials for this Owner
Home Financials are based on the most recent Mortgage that was taken out on this home.
Original Mortgage
$151,800
Interest Rate
6.73%
Purchase Details
Closed on
Apr 25, 2000
Sold by
Barroso Ana Maria
Bought by
Barroso Mario
Purchase Details
Closed on
Dec 10, 1999
Sold by
Ghazarian Zuhrab and Ghazarian Seta
Bought by
Shat Enterprises Llc
Purchase Details
Closed on
Jun 29, 1995
Sold by
Ghazarian Zuhrab and Ghazarian Seta
Bought by
Ghazarian Zuhrab
Create a Home Valuation Report for This Property
The Home Valuation Report is an in-depth analysis detailing your home's value as well as a comparison with similar homes in the area
Home Values in the Area
Average Home Value in this Area
Purchase History
| Date | Buyer | Sale Price | Title Company |
|---|---|---|---|
| Spears Penn Velma M | -- | North American Title Co | |
| Spears Penn Velma M | $156,500 | North American Title Co | |
| Shat Enterprises Llc | -- | North American Title Co | |
| Barroso Mario | -- | -- | |
| Shat Enterprises Llc | -- | -- | |
| Ghazarian Zuhrab | -- | -- |
Source: Public Records
Mortgage History
| Date | Status | Borrower | Loan Amount |
|---|---|---|---|
| Previous Owner | Spears Penn Velma M | $151,800 |
Source: Public Records
Tax History Compared to Growth
Tax History
| Year | Tax Paid | Tax Assessment Tax Assessment Total Assessment is a certain percentage of the fair market value that is determined by local assessors to be the total taxable value of land and additions on the property. | Land | Improvement |
|---|---|---|---|---|
| 2025 | $3,254 | $231,174 | $80,352 | $150,822 |
| 2024 | $3,254 | $226,642 | $78,777 | $147,865 |
| 2023 | $3,200 | $222,199 | $77,233 | $144,966 |
| 2022 | $3,015 | $217,843 | $75,719 | $142,124 |
| 2021 | $2,951 | $213,573 | $74,235 | $139,338 |
| 2019 | $2,908 | $207,240 | $72,034 | $135,206 |
| 2018 | $2,820 | $203,177 | $70,622 | $132,555 |
| 2016 | $2,603 | $195,289 | $67,881 | $127,408 |
| 2015 | $2,511 | $192,357 | $66,862 | $125,495 |
| 2014 | $2,500 | $188,590 | $65,553 | $123,037 |
Source: Public Records
Map
Nearby Homes
- 2370 Lime Ave
- 2366 Linden Ave
- 2225 Olive Ave
- 1460 E Willow St Unit 202
- 1460 E Willow St Unit 103
- 2599 Walnut Ave
- 2310 Elm Ave
- 2655 Walnut Ave
- 2100 Martin Luther King Junior Ave
- 2337 Long Beach Blvd
- 2123 Atlantic Ave
- 211 1/2 E Eagle St
- 2430 Gaviota Ave
- 2420 Gaviota Ave
- 1211 E Leigh Ct
- 2051 Orange Ave
- 2240 Walnut Ave
- 2238 Walnut Ave
- 1015 E 20th St
- 2093 Pasadena Ave
- 2533 California Ave Unit 2
- 2535 California Ave Unit 1
- 2537 California Ave
- 2539 California Ave Unit 6
- 2533 California Ave
- 2535 California Ave
- 2525 California Ave Unit 8
- 2527 California Ave
- 2529 California Ave
- 940 E Vernon St
- 928 E Vernon St
- 967 E Vernon St
- 999 E 25th St
- 935 E Vernon St
- 935 E 25th St
- 933 E Vernon St
- 921 E 25th St
- 967 E 25th St
- 924 E Vernon St
- 909 E 25th St