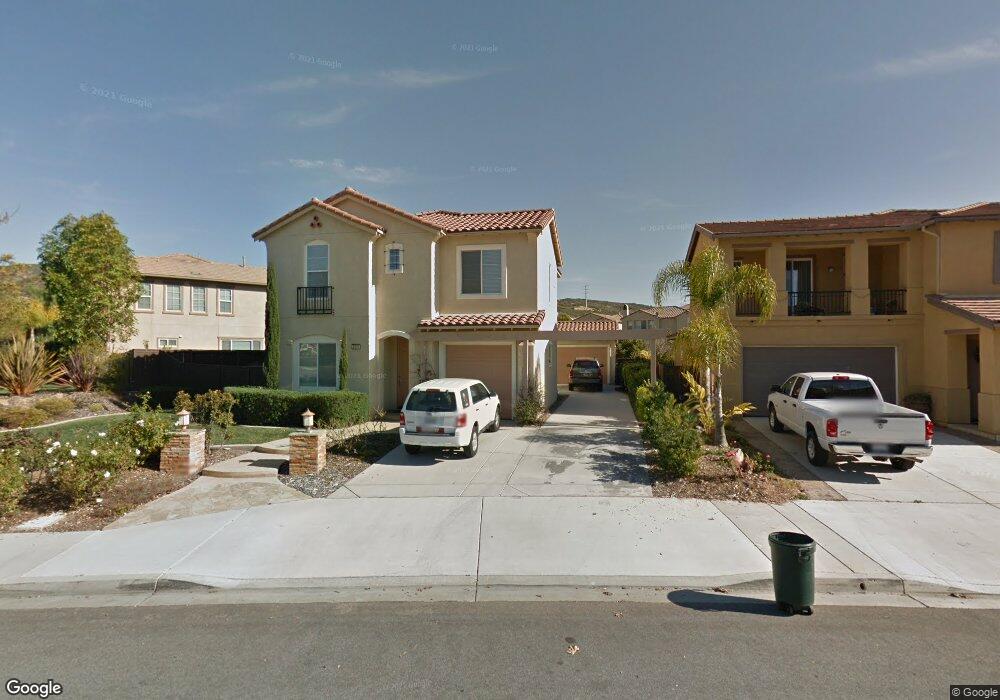
2531 Corbel Way San Marcos, CA 92078
Estimated Value: $1,536,000 - $1,847,000
4
Beds
3
Baths
3,047
Sq Ft
$540/Sq Ft
Est. Value
About This Home
This home is located at 2531 Corbel Way, San Marcos, CA 92078 and is currently estimated at $1,645,494, approximately $540 per square foot. 2531 Corbel Way is a home located in San Diego County with nearby schools including Carrillo Elementary, San Elijo Middle School, and San Marcos High School.
Ownership History
Date
Name
Owned For
Owner Type
Purchase Details
Closed on
Feb 17, 2012
Sold by
Pollinger Chad and Wetherill Rebecca
Bought by
Mahmood Majid and Shafi Aisha S
Current Estimated Value
Home Financials for this Owner
Home Financials are based on the most recent Mortgage that was taken out on this home.
Original Mortgage
$412,000
Outstanding Balance
$281,449
Interest Rate
3.83%
Mortgage Type
New Conventional
Estimated Equity
$1,364,045
Purchase Details
Closed on
Feb 8, 2005
Sold by
Centex Homes
Bought by
Pollinger Chad and Wetherill Rebecca
Home Financials for this Owner
Home Financials are based on the most recent Mortgage that was taken out on this home.
Original Mortgage
$589,500
Interest Rate
5.25%
Mortgage Type
Purchase Money Mortgage
Create a Home Valuation Report for This Property
The Home Valuation Report is an in-depth analysis detailing your home's value as well as a comparison with similar homes in the area
Home Values in the Area
Average Home Value in this Area
Purchase History
| Date | Buyer | Sale Price | Title Company |
|---|---|---|---|
| Mahmood Majid | $515,000 | Lawyers Title | |
| Pollinger Chad | $737,000 | Commerce Title |
Source: Public Records
Mortgage History
| Date | Status | Borrower | Loan Amount |
|---|---|---|---|
| Open | Mahmood Majid | $412,000 | |
| Previous Owner | Pollinger Chad | $589,500 |
Source: Public Records
Tax History Compared to Growth
Tax History
| Year | Tax Paid | Tax Assessment Tax Assessment Total Assessment is a certain percentage of the fair market value that is determined by local assessors to be the total taxable value of land and additions on the property. | Land | Improvement |
|---|---|---|---|---|
| 2025 | $9,229 | $646,857 | $322,801 | $324,056 |
| 2024 | $9,229 | $634,174 | $316,472 | $317,702 |
| 2023 | $9,300 | $621,740 | $310,267 | $311,473 |
| 2022 | $9,183 | $609,550 | $304,184 | $305,366 |
| 2021 | $8,407 | $597,599 | $298,220 | $299,379 |
| 2020 | $8,977 | $591,473 | $295,163 | $296,310 |
| 2019 | $8,953 | $579,876 | $289,376 | $290,500 |
| 2018 | $8,790 | $568,506 | $283,702 | $284,804 |
| 2017 | $8,659 | $557,360 | $278,140 | $279,220 |
| 2016 | $8,509 | $546,433 | $272,687 | $273,746 |
| 2015 | $8,444 | $538,226 | $268,591 | $269,635 |
| 2014 | $8,284 | $527,684 | $263,330 | $264,354 |
Source: Public Records
Map
Nearby Homes
- 2509 Blue Oak Place
- 2184 Cosmo Way
- 2192 Cosmo Way
- 2241 Indus Way
- 1823 Sheridan Way
- 1616 Windemere Dr
- 7148 Sitio Caliente
- 2145 Silverado St
- 2092 Silverado St
- 1649 Portside Place
- 1452 Golden Sunset Dr
- 3430 Filoli Cir
- 3414 Filoli Cir
- 2513 Antlers Way
- 2533 Antlers Way
- 1656 Avery Rd
- 1607 Avery Rd
- 1276 San Elijo Rd N
- 1264 San Elijo Rd N
- 1159 Elfin Forest Rd E
- 2537 Corbel Way
- 2529 Blue Oak Place
- 2523 Blue Oak Place
- 2541 Corbel Way
- 2538 Corbel Way
- 2536 Corbel Way
- 2517 Blue Oak Place
- 2520 Blue Oak Place
- 2540 Corbel Way
- 1824 Shadetree Dr
- 2543 Corbel Way Unit 6
- 1818 Shadetree Dr
- 2542 Corbel Way
- 2514 Blue Oak Place
- 2534 Corbel Way
- 1830 Shadetree Dr Unit 10
- 1816 Shadetree Dr
- 2544 Corbel Way
- 2545 Corbel Way
- 2508 Blue Oak Place