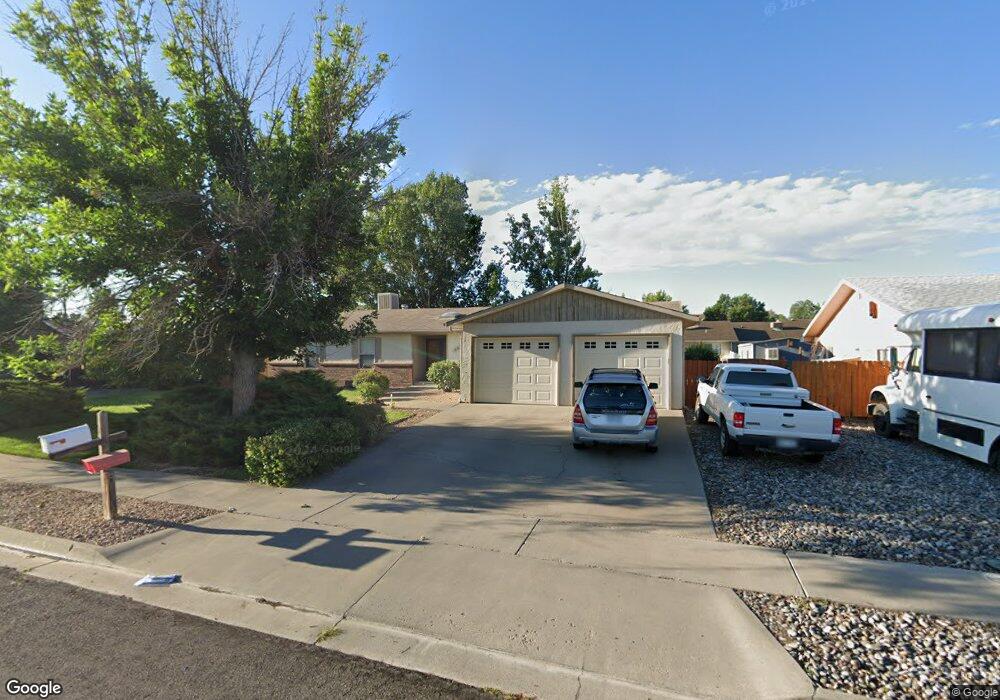
2531 Pheasant Run Cir Grand Junction, CO 81506
North Grand Junction NeighborhoodEstimated Value: $439,000 - $481,000
3
Beds
2
Baths
1,802
Sq Ft
$256/Sq Ft
Est. Value
About This Home
This home is located at 2531 Pheasant Run Cir, Grand Junction, CO 81506 and is currently estimated at $460,728, approximately $255 per square foot. 2531 Pheasant Run Cir is a home located in Mesa County with nearby schools including Orchard Avenue Elementary School, West Middle School, and East Middle School.
Ownership History
Date
Name
Owned For
Owner Type
Purchase Details
Closed on
Aug 21, 2003
Sold by
Bellco Cu
Bought by
Leane Brigham B and Leane Kimberly A
Current Estimated Value
Home Financials for this Owner
Home Financials are based on the most recent Mortgage that was taken out on this home.
Original Mortgage
$128,000
Outstanding Balance
$58,249
Interest Rate
6.08%
Mortgage Type
Purchase Money Mortgage
Estimated Equity
$402,479
Purchase Details
Closed on
Mar 10, 2003
Sold by
Mcnary Cynthia A
Bought by
Bellco Cu
Purchase Details
Closed on
Jun 30, 1997
Sold by
James A Belgard Kathleen M
Bought by
Mcnary Cynthia A
Home Financials for this Owner
Home Financials are based on the most recent Mortgage that was taken out on this home.
Original Mortgage
$126,350
Interest Rate
7.94%
Purchase Details
Closed on
Mar 5, 1992
Sold by
Koler Keith E
Bought by
Leane Kimberly A
Create a Home Valuation Report for This Property
The Home Valuation Report is an in-depth analysis detailing your home's value as well as a comparison with similar homes in the area
Home Values in the Area
Average Home Value in this Area
Purchase History
| Date | Buyer | Sale Price | Title Company |
|---|---|---|---|
| Leane Brigham B | $160,000 | First American Heritage Titl | |
| Bellco Cu | $20,000 | -- | |
| Mcnary Cynthia A | $133,000 | -- | |
| Leane Kimberly A | $99,000 | -- |
Source: Public Records
Mortgage History
| Date | Status | Borrower | Loan Amount |
|---|---|---|---|
| Open | Leane Brigham B | $128,000 | |
| Previous Owner | Mcnary Cynthia A | $126,350 |
Source: Public Records
Tax History Compared to Growth
Tax History
| Year | Tax Paid | Tax Assessment Tax Assessment Total Assessment is a certain percentage of the fair market value that is determined by local assessors to be the total taxable value of land and additions on the property. | Land | Improvement |
|---|---|---|---|---|
| 2024 | $1,627 | $23,580 | $6,370 | $17,210 |
| 2023 | $1,627 | $23,580 | $6,370 | $17,210 |
| 2022 | $1,414 | $20,160 | $5,210 | $14,950 |
| 2021 | $1,420 | $20,740 | $5,360 | $15,380 |
| 2020 | $1,231 | $18,420 | $4,650 | $13,770 |
| 2019 | $1,164 | $18,420 | $4,650 | $13,770 |
| 2018 | $1,188 | $17,120 | $4,320 | $12,800 |
| 2017 | $1,186 | $17,120 | $4,320 | $12,800 |
| 2016 | $1,038 | $16,860 | $4,380 | $12,480 |
| 2015 | $1,053 | $16,860 | $4,380 | $12,480 |
| 2014 | $960 | $15,470 | $4,380 | $11,090 |
Source: Public Records
Map
Nearby Homes
- 2311 Pheasant Run Cir
- 2809 Day Break Ave
- 108 E Park Ave
- 2912 Applewood St
- 1937 Hawthorne Ave
- 2802 Grand View Cir
- 2115 N 24th St
- 2836 Grand Falls Cir Unit A
- 1890 & 1895 Wellington Ave
- 1945 N 24th St
- 2738 Patterson Rd
- 1628 Lowell Ln
- 2803 Northstar Dr
- 3658 Ridge Dr
- 690 27 1 2 Rd
- 3715 Elderberry Cir
- 554 Princess St
- 666 Windstar Dr
- 2202 Orchard Ave
- 586 28 1 2 Rd
- 0 Pheasant Run Cir
- 2525 Pheasant Run Cir
- 2533 Pheasant Run Cir
- 2650 Springside Ct Unit C
- 2650 Springside Ct Unit A
- 2530 Pheasant Run Cir
- 2515 Pheasant Run Cir
- 2610 Springside Ct Unit C
- 2610 Springside Ct Unit B
- 2610 Springside Ct Unit A
- 2520 Pheasant Run Cir
- 2910 Pheasant Run Cir
- 2550 Springside Ct Unit C
- 2550 Springside Ct Unit A
- 2710 Springside Ct Unit C
- 2710 Springside Ct Unit B
- 2710 Springside Ct Unit A
- 2501 Pheasant Run Cir
- 2510 Pheasant Run Cir
- 2920 Pheasant Run Cir