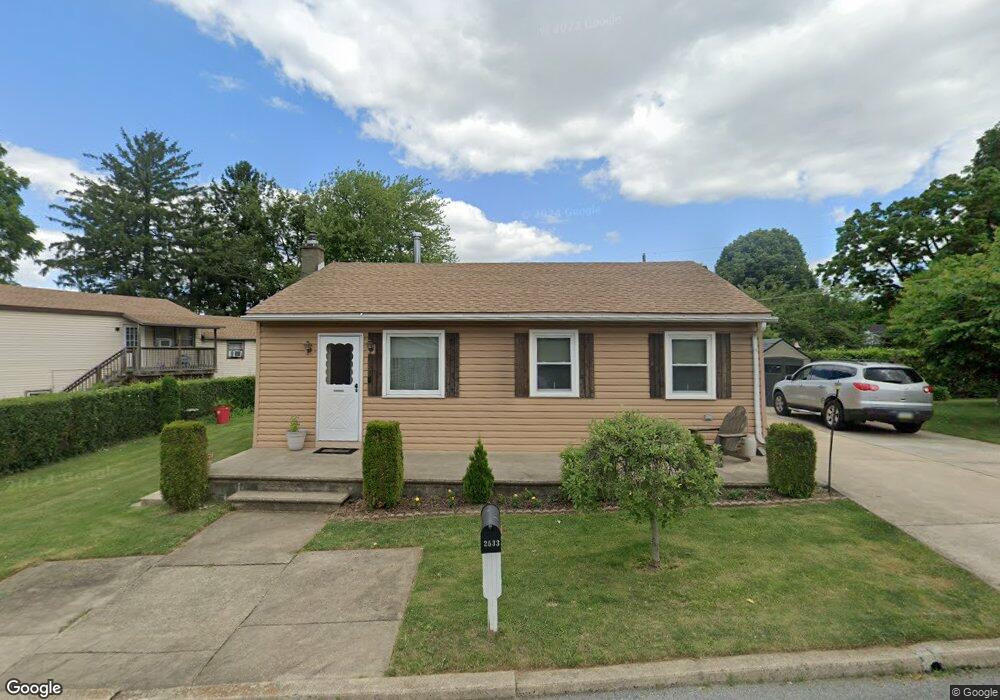
2531 Shaler St Unit 2543 Allentown, PA 18103
Southside NeighborhoodEstimated Value: $240,000 - $285,000
3
Beds
1
Bath
896
Sq Ft
$288/Sq Ft
Est. Value
About This Home
This home is located at 2531 Shaler St Unit 2543, Allentown, PA 18103 and is currently estimated at $257,924, approximately $287 per square foot. 2531 Shaler St Unit 2543 is a home located in Lehigh County with nearby schools including Lehigh Park Elementary School, South Mountain Middle School, and William Allen High School.
Ownership History
Date
Name
Owned For
Owner Type
Purchase Details
Closed on
Aug 15, 2014
Sold by
Muth Dolores M and Spohn Vicki L
Bought by
Schmidt Kevin
Current Estimated Value
Home Financials for this Owner
Home Financials are based on the most recent Mortgage that was taken out on this home.
Original Mortgage
$82,800
Outstanding Balance
$63,158
Interest Rate
4.12%
Mortgage Type
New Conventional
Estimated Equity
$194,766
Purchase Details
Closed on
Aug 13, 2014
Sold by
Muth Dolores M and Spohn Vicki L
Bought by
Muth Dolores M
Home Financials for this Owner
Home Financials are based on the most recent Mortgage that was taken out on this home.
Original Mortgage
$82,800
Outstanding Balance
$63,158
Interest Rate
4.12%
Mortgage Type
New Conventional
Estimated Equity
$194,766
Purchase Details
Closed on
Jun 3, 1958
Bought by
Muth Roy M A and Muth Dolores M
Create a Home Valuation Report for This Property
The Home Valuation Report is an in-depth analysis detailing your home's value as well as a comparison with similar homes in the area
Home Values in the Area
Average Home Value in this Area
Purchase History
| Date | Buyer | Sale Price | Title Company |
|---|---|---|---|
| Schmidt Kevin | $92,000 | None Available | |
| Muth Dolores M | -- | None Available | |
| Muth Roy M A | $5,400 | -- |
Source: Public Records
Mortgage History
| Date | Status | Borrower | Loan Amount |
|---|---|---|---|
| Open | Schmidt Kevin | $82,800 |
Source: Public Records
Tax History Compared to Growth
Tax History
| Year | Tax Paid | Tax Assessment Tax Assessment Total Assessment is a certain percentage of the fair market value that is determined by local assessors to be the total taxable value of land and additions on the property. | Land | Improvement |
|---|---|---|---|---|
| 2025 | $3,608 | $98,500 | $29,700 | $68,800 |
| 2024 | $3,608 | $98,500 | $29,700 | $68,800 |
| 2023 | $3,608 | $98,500 | $29,700 | $68,800 |
| 2022 | $3,496 | $98,500 | $68,800 | $29,700 |
| 2021 | $3,434 | $98,500 | $29,700 | $68,800 |
| 2020 | $3,355 | $98,500 | $29,700 | $68,800 |
| 2019 | $3,307 | $98,500 | $29,700 | $68,800 |
| 2018 | $3,030 | $98,500 | $29,700 | $68,800 |
| 2017 | $2,961 | $98,500 | $29,700 | $68,800 |
| 2016 | -- | $98,500 | $29,700 | $68,800 |
| 2015 | -- | $98,500 | $29,700 | $68,800 |
| 2014 | -- | $98,500 | $29,700 | $68,800 |
Source: Public Records
Map
Nearby Homes
- 2616 Arch St SW
- 3011 Ithaca St
- 1066 Devonshire Rd Unit 1068
- 2147 S Poplar St
- 1950 Oxford Dr
- 2343 S 9th St
- 635 E Berger St
- 506 Evergreen St
- 1992 S Delaware St
- 2348 S Church St
- 2413 S Church St
- 2401 S Church St
- 1901 S Delaware St
- 781 Mohawk St
- 566 W Emaus Ave
- 566 588 W Emaus Ave
- 2347 S Law St Unit 2349
- 2416 S Alice St Unit 2418
- 3017 S Pike Ave
- 558 Beechwood St
- 2533 Shaler St
- 2530 26th St SW
- 2538 Shaler St Unit 2544
- 2530 Shaler St Unit 2536
- 2524 26th St SW Unit 2528
- 2533 26th St SW Unit 2541
- 2543 26th St SW Unit 2551
- 2527 26th St SW
- 2527 SW 26th St
- 2523 26th St SW Unit 2531
- 2520 Shaler St Unit 2526
- 2546 Shaler St Unit 2554
- 2511 Shaler St Unit 2521
- 2557 26th St SW
- 2518 26th St SW
- 2553 26th St SW
- 2514 26th St SW Unit 2520
- 2541 27th St SW Unit 2545
- 2531 27th St SW Unit 2537
- 2521 26th St SW