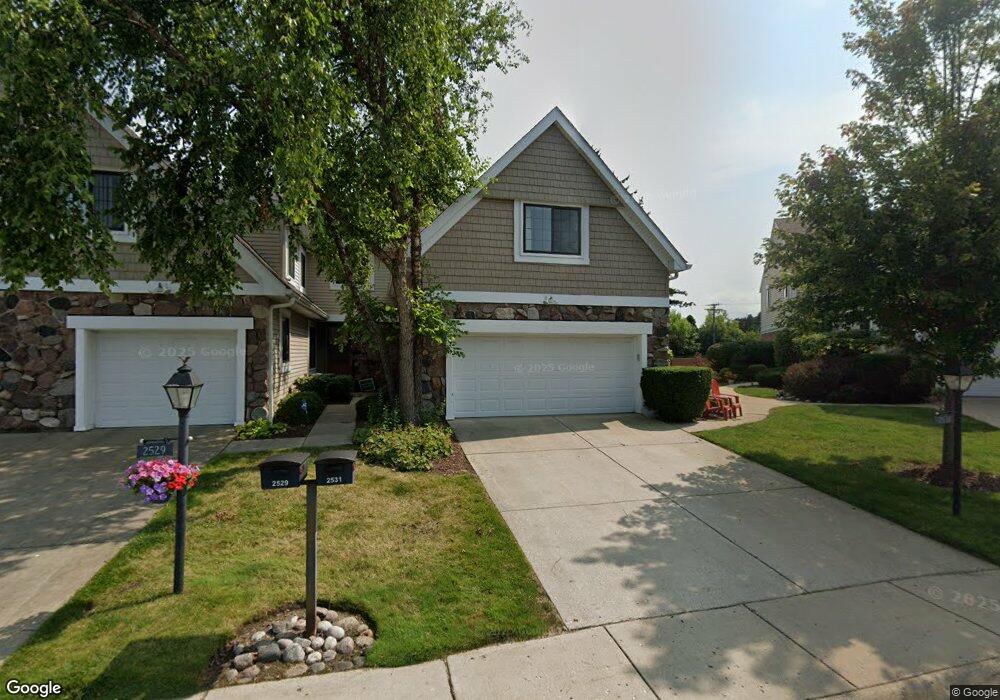
2531 Windsor Ln Northbrook, IL 60062
Estimated Value: $515,000 - $574,000
4
Beds
3
Baths
2,255
Sq Ft
$246/Sq Ft
Est. Value
About This Home
This home is located at 2531 Windsor Ln, Northbrook, IL 60062 and is currently estimated at $555,552, approximately $246 per square foot. 2531 Windsor Ln is a home located in Cook County with nearby schools including Wescott Elementary School, Maple School, and Glenbrook North High School.
Ownership History
Date
Name
Owned For
Owner Type
Purchase Details
Closed on
Mar 18, 2018
Sold by
Pitler Sabra
Bought by
Davidove Holli
Current Estimated Value
Purchase Details
Closed on
Jun 14, 2002
Sold by
Guaranty Trust Company
Bought by
Pitler Sabra and The Sabra Pitler Trust
Home Financials for this Owner
Home Financials are based on the most recent Mortgage that was taken out on this home.
Original Mortgage
$250,000
Interest Rate
6.82%
Purchase Details
Closed on
Mar 1, 2000
Sold by
Small Matthew L
Bought by
Guaranty Trust Company and Trust #L000-006
Create a Home Valuation Report for This Property
The Home Valuation Report is an in-depth analysis detailing your home's value as well as a comparison with similar homes in the area
Home Values in the Area
Average Home Value in this Area
Purchase History
| Date | Buyer | Sale Price | Title Company |
|---|---|---|---|
| Davidove Holli | -- | None Available | |
| Pitler Sabra | $350,000 | -- | |
| Guaranty Trust Company | $235,000 | -- |
Source: Public Records
Mortgage History
| Date | Status | Borrower | Loan Amount |
|---|---|---|---|
| Previous Owner | Pitler Sabra | $250,000 |
Source: Public Records
Tax History
| Year | Tax Paid | Tax Assessment Tax Assessment Total Assessment is a certain percentage of the fair market value that is determined by local assessors to be the total taxable value of land and additions on the property. | Land | Improvement |
|---|---|---|---|---|
| 2025 | $8,670 | $51,000 | $9,281 | $41,719 |
| 2024 | $8,670 | $40,000 | $6,500 | $33,500 |
| 2023 | $8,410 | $40,000 | $6,500 | $33,500 |
| 2022 | $8,410 | $40,000 | $6,500 | $33,500 |
| 2021 | $8,014 | $34,189 | $3,093 | $31,096 |
| 2020 | $7,993 | $34,189 | $3,093 | $31,096 |
| 2019 | $7,690 | $37,571 | $3,093 | $34,478 |
| 2018 | $8,570 | $38,549 | $2,706 | $35,843 |
| 2017 | $8,409 | $38,549 | $2,706 | $35,843 |
| 2016 | $7,753 | $38,549 | $2,706 | $35,843 |
| 2015 | $7,489 | $33,899 | $2,191 | $31,708 |
| 2014 | $7,315 | $33,899 | $2,191 | $31,708 |
| 2013 | $7,207 | $33,899 | $2,191 | $31,708 |
Source: Public Records
Map
Nearby Homes
- 2533 Windsor Ln
- 3100 Lexington Ln Unit 312
- 2050 Valencia Dr Unit 300C
- 2745 Quail Ln
- 102 Yale Ct Unit 34LH10
- 3501 Lawson Rd
- 3806 Michael Ln
- 2432 Auburn Ln
- 2110 Pfingsten Rd
- 2100 Pfingsten Rd
- 3005 Highland Rd
- 1943 Sunnyside Cir
- 1941 Kingsley Cir
- 3800 Kiess Dr
- 1817 Somerset Ln Unit 24
- 1772 Lancaster Way
- 3293 Doriann Dr
- 2531 Violet St
- 2464 Violet St
- 3282 Doriann Dr
- 2529 Windsor Ln
- 2527 Windsor Ln
- 2525 Windsor Ln
- 2535 Windsor Ln
- 2537 Windsor Ln
- 2539 Windsor Ln
- 2523 Windsor Ln
- 2541 Windsor Ln
- 2517 Windsor Ln
- 2543 Windsor Ln
- 2543 Windsor Ln
- 2545 Windsor Ln
- 2547 Windsor Ln
- 2547 Windsor Ln
- 2547 Windsor Ln Unit 2547
- 2549 Windsor Ln
- 2549 Windsor Ln
- 2556 Virginia Ln
- 2515 Windsor Ln
- 2316 Castilian Cir
Your Personal Tour Guide
Ask me questions while you tour the home.