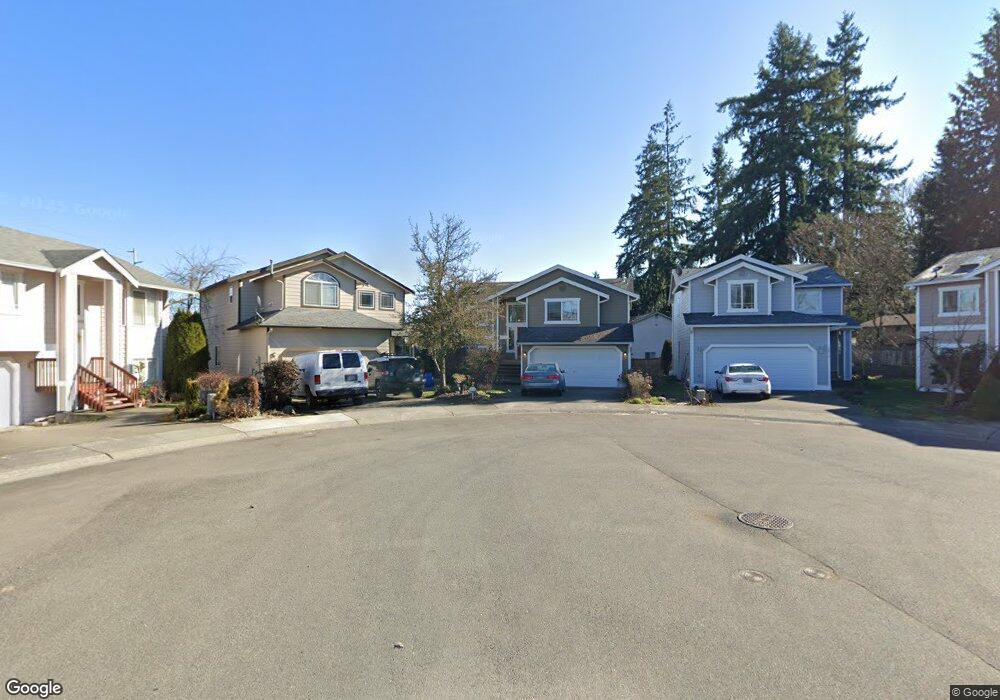
2532 132nd Place SE Mill Creek, WA 98012
Estimated Value: $741,000 - $887,000
4
Beds
3
Baths
1,638
Sq Ft
$491/Sq Ft
Est. Value
About This Home
This home is located at 2532 132nd Place SE, Mill Creek, WA 98012 and is currently estimated at $804,791, approximately $491 per square foot. 2532 132nd Place SE is a home located in Snohomish County with nearby schools including Mill Creek Elementary School, Heatherwood Middle School, and Henry M. Jackson High School.
Ownership History
Date
Name
Owned For
Owner Type
Purchase Details
Closed on
May 5, 2014
Sold by
Mudd David W and Mudd Tara L
Bought by
Ih4 Property Washington Lp
Current Estimated Value
Purchase Details
Closed on
Feb 25, 2005
Sold by
Ware Lennard and Marrott Ware Anu
Bought by
Mudd David W and Mudd Tara L
Home Financials for this Owner
Home Financials are based on the most recent Mortgage that was taken out on this home.
Original Mortgage
$211,560
Interest Rate
5.5%
Mortgage Type
Purchase Money Mortgage
Purchase Details
Closed on
Dec 13, 1999
Sold by
Klp Inc
Bought by
Ware Lennard and Marrott Ware Anu
Home Financials for this Owner
Home Financials are based on the most recent Mortgage that was taken out on this home.
Original Mortgage
$165,796
Interest Rate
7.82%
Mortgage Type
VA
Create a Home Valuation Report for This Property
The Home Valuation Report is an in-depth analysis detailing your home's value as well as a comparison with similar homes in the area
Home Values in the Area
Average Home Value in this Area
Purchase History
| Date | Buyer | Sale Price | Title Company |
|---|---|---|---|
| Ih4 Property Washington Lp | $265,100 | Fidelity National Title | |
| Mudd David W | $264,450 | Stewart Title Company | |
| Ware Lennard | -- | -- |
Source: Public Records
Mortgage History
| Date | Status | Borrower | Loan Amount |
|---|---|---|---|
| Previous Owner | Mudd David W | $211,560 | |
| Previous Owner | Ware Lennard | $165,796 | |
| Closed | Mudd David W | $52,890 |
Source: Public Records
Tax History Compared to Growth
Tax History
| Year | Tax Paid | Tax Assessment Tax Assessment Total Assessment is a certain percentage of the fair market value that is determined by local assessors to be the total taxable value of land and additions on the property. | Land | Improvement |
|---|---|---|---|---|
| 2025 | $6,147 | $716,600 | $480,000 | $236,600 |
| 2024 | $6,147 | $673,900 | $440,000 | $233,900 |
| 2023 | $6,787 | $796,100 | $530,000 | $266,100 |
| 2022 | $4,854 | $530,300 | $305,000 | $225,300 |
| 2020 | $4,892 | $432,200 | $238,000 | $194,200 |
| 2019 | $4,270 | $382,000 | $195,000 | $187,000 |
| 2018 | $3,767 | $311,900 | $170,000 | $141,900 |
| 2017 | $3,294 | $271,900 | $140,000 | $131,900 |
| 2016 | $2,789 | $244,500 | $118,000 | $126,500 |
| 2015 | $2,854 | $237,700 | $111,000 | $126,700 |
| 2013 | $2,665 | $199,100 | $103,000 | $96,100 |
Source: Public Records
Map
Nearby Homes
- 2616 132nd St SE
- 2704 130th St SE
- 2410 134th Place SE
- 2406 134th Place SE
- 13004 25th Ave SE
- 2408 136th St SE
- Plan 3155 at Silver Lake's Ambleside
- Plan 2761 at Silver Lake's Ambleside
- Plan 2746 at Silver Lake's Ambleside
- Plan 2570 at Silver Lake's Ambleside
- Plan 2330 at Silver Lake's Ambleside
- Plan 2198 at Silver Lake's Ambleside
- Plan 2070 at Silver Lake's Ambleside
- 2431 137th Place SE
- 2929 Silver Crest Dr
- 13709 30th Dr SE
- 14103 26th Ct SE
- 14212 28th Dr SE
- 2314 140th Place SE
- 14024 32nd Dr SE
- 2530 132nd Place SE
- 2531 132nd Place SE
- 2528 132nd Place SE
- 2529 132nd Place SE
- 2618 132nd St SE
- 2620 132nd St SE
- 2620 132nd St SE Unit B
- 2524 132nd Place SE
- 2523 132nd Place SE
- 2604 132nd St SE
- 2605 133rd Place SE
- 2520 132nd Place SE
- 2531 133rd Place SE
- 2630 132nd St SE
- 2630 132nd St SE
- 2630 132nd St SE Unit A
- 2630 132nd St SE Unit B
- 2519 132nd Place SE
- 2611 133rd Place SE
- 2523 133rd Place SE