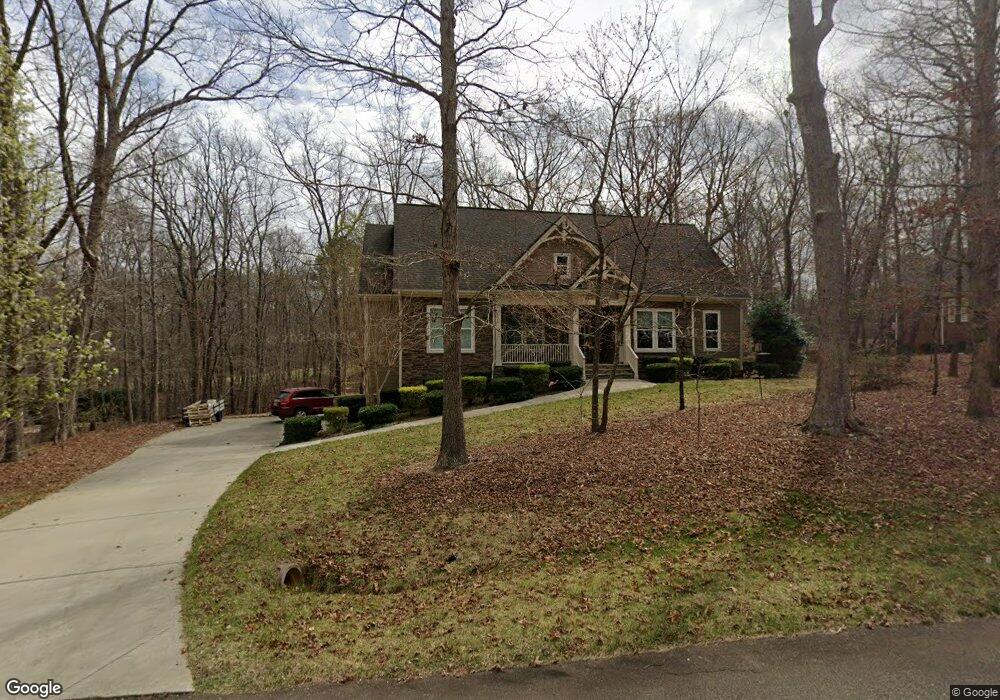
2532 Leas Mill Ct Raleigh, NC 27606
Estimated Value: $635,300 - $797,000
--
Bed
1
Bath
2,350
Sq Ft
$304/Sq Ft
Est. Value
About This Home
This home is located at 2532 Leas Mill Ct, Raleigh, NC 27606 and is currently estimated at $713,825, approximately $303 per square foot. 2532 Leas Mill Ct is a home located in Wake County with nearby schools including Yates Mill Elementary School, Dillard Drive Magnet Middle School, and Adventist Christian Academy of Raleigh.
Ownership History
Date
Name
Owned For
Owner Type
Purchase Details
Closed on
Mar 15, 2013
Sold by
Bailey Jesse Mcarthur and Bailey Audrey Kates
Bought by
Leise Larence E and Luerich Susan Ann
Current Estimated Value
Home Financials for this Owner
Home Financials are based on the most recent Mortgage that was taken out on this home.
Original Mortgage
$312,000
Outstanding Balance
$224,559
Interest Rate
3.5%
Mortgage Type
Adjustable Rate Mortgage/ARM
Estimated Equity
$489,266
Purchase Details
Closed on
Jun 9, 2003
Sold by
Herrin Timothy Alan
Bought by
Bailey Jesse Mcarthur and Bailey Audrey Kates
Home Financials for this Owner
Home Financials are based on the most recent Mortgage that was taken out on this home.
Original Mortgage
$71,900
Interest Rate
5.79%
Mortgage Type
Purchase Money Mortgage
Purchase Details
Closed on
Apr 4, 2002
Sold by
Herrin Andrea Miller
Bought by
Herrin Timothy A
Create a Home Valuation Report for This Property
The Home Valuation Report is an in-depth analysis detailing your home's value as well as a comparison with similar homes in the area
Home Values in the Area
Average Home Value in this Area
Purchase History
| Date | Buyer | Sale Price | Title Company |
|---|---|---|---|
| Leise Larence E | -- | None Available | |
| Bailey Jesse Mcarthur | $80,000 | -- | |
| Herrin Timothy A | -- | -- |
Source: Public Records
Mortgage History
| Date | Status | Borrower | Loan Amount |
|---|---|---|---|
| Open | Leise Larence E | $312,000 | |
| Previous Owner | Bailey Jesse Mcarthur | $71,900 |
Source: Public Records
Tax History Compared to Growth
Tax History
| Year | Tax Paid | Tax Assessment Tax Assessment Total Assessment is a certain percentage of the fair market value that is determined by local assessors to be the total taxable value of land and additions on the property. | Land | Improvement |
|---|---|---|---|---|
| 2025 | $4,103 | $638,434 | $120,000 | $518,434 |
| 2024 | $3,985 | $638,434 | $120,000 | $518,434 |
| 2023 | $3,509 | $447,469 | $96,000 | $351,469 |
| 2022 | $3,252 | $447,469 | $96,000 | $351,469 |
| 2021 | $3,164 | $447,469 | $96,000 | $351,469 |
| 2020 | $3,112 | $447,469 | $96,000 | $351,469 |
| 2019 | $3,522 | $428,814 | $96,000 | $332,814 |
| 2018 | $3,238 | $428,814 | $96,000 | $332,814 |
| 2017 | $3,069 | $428,814 | $96,000 | $332,814 |
| 2016 | $3,007 | $428,814 | $96,000 | $332,814 |
| 2015 | $2,919 | $417,351 | $100,000 | $317,351 |
| 2014 | $2,766 | $501,873 | $100,000 | $401,873 |
Source: Public Records
Map
Nearby Homes
- 4700 Carolton Dr
- 5125 Penny Rd
- 4009 Yates Mill Pond Rd
- 1337 Sanctuary Pond Dr
- 4908 Birchleaf Dr
- 2828 Theresa Eileen Way
- 2824 Theresa Eileen Way
- 5200 Bent Leaf Dr
- 5209 Bent Leaf Dr
- 5213 Bent Leaf Dr
- 2412 Spindle Ct
- 4720 Yates Mill Pond Rd
- 5505 Swiftbrook Cir
- 347 Augusta Pond Way Unit 177
- 5717 Allwood Dr
- 343 Augusta Pond Way Unit 176
- 339 Augusta Pond Way Unit 175
- 760 Georgias Landing Pkwy Unit 2
- 331 Augusta Pond Way Unit 173
- 756 Georgias Landing Pkwy Unit 3
- 2540 Leas Mill Ct
- 2516 Leas Mill Ct
- 2521 Leas Mill Ct
- 5418 Penny Rd
- 2505 Leas Mill Ct
- 2504 Leas Mill Ct
- 5404 Penny Rd
- 5316 Penny Rd
- 5500 Penny Rd
- 5312 Penny Rd
- 5408 Penny Rd
- 2500 Leas Mill Ct
- 5308 Penny Rd
- 5416 Penny Rd
- 5420 Penny Rd
- 5317 Penny Rd
- 5300 Penny Rd
- 5313 Penny Rd
- 5504 Penny Rd
- 5309 Penny Rd