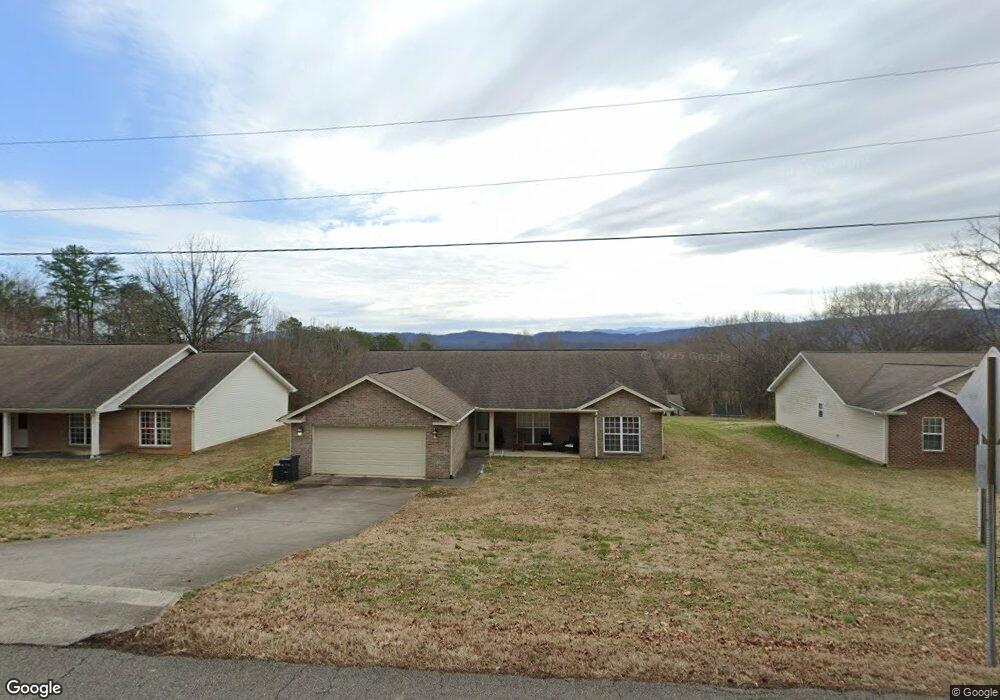
2532 Peach Orchard Rd Maryville, TN 37803
Estimated Value: $329,000 - $437,000
3
Beds
2
Baths
1,698
Sq Ft
$229/Sq Ft
Est. Value
About This Home
This home is located at 2532 Peach Orchard Rd, Maryville, TN 37803 and is currently estimated at $389,111, approximately $229 per square foot. 2532 Peach Orchard Rd is a home located in Blount County with nearby schools including Montvale Elementary School, Heritage Middle School, and Heritage High School.
Ownership History
Date
Name
Owned For
Owner Type
Purchase Details
Closed on
Jul 26, 2018
Sold by
Shepherd Angela
Bought by
Shepherd Michael A and Angela
Current Estimated Value
Home Financials for this Owner
Home Financials are based on the most recent Mortgage that was taken out on this home.
Original Mortgage
$199,192
Outstanding Balance
$172,630
Interest Rate
4.5%
Mortgage Type
New Conventional
Estimated Equity
$216,481
Purchase Details
Closed on
May 15, 2012
Sold by
Varner Michael G Melissa
Bought by
Shepherd Anglea
Home Financials for this Owner
Home Financials are based on the most recent Mortgage that was taken out on this home.
Original Mortgage
$178,571
Interest Rate
3.9%
Mortgage Type
Commercial
Purchase Details
Closed on
Sep 26, 2008
Sold by
Rose James Michael
Bought by
Varner Michael G
Home Financials for this Owner
Home Financials are based on the most recent Mortgage that was taken out on this home.
Original Mortgage
$130,320
Interest Rate
6.36%
Purchase Details
Closed on
Aug 6, 2008
Sold by
Rose James Michael
Bought by
Jim White Builders Inc
Home Financials for this Owner
Home Financials are based on the most recent Mortgage that was taken out on this home.
Original Mortgage
$130,320
Interest Rate
6.36%
Purchase Details
Closed on
Jan 5, 2007
Bought by
Ridout Llc
Create a Home Valuation Report for This Property
The Home Valuation Report is an in-depth analysis detailing your home's value as well as a comparison with similar homes in the area
Home Values in the Area
Average Home Value in this Area
Purchase History
| Date | Buyer | Sale Price | Title Company |
|---|---|---|---|
| Shepherd Michael A | -- | -- | |
| Shepherd Anglea | $175,000 | -- | |
| Varner Michael G | $162,900 | -- | |
| Jim White Builders Inc | $163,000 | -- | |
| Ridout Llc | $170,000 | -- |
Source: Public Records
Mortgage History
| Date | Status | Borrower | Loan Amount |
|---|---|---|---|
| Open | Shepherd Michael A | $199,192 | |
| Previous Owner | Shepherd Anglea | $178,571 | |
| Previous Owner | Ridout Llc | $130,320 |
Source: Public Records
Tax History Compared to Growth
Tax History
| Year | Tax Paid | Tax Assessment Tax Assessment Total Assessment is a certain percentage of the fair market value that is determined by local assessors to be the total taxable value of land and additions on the property. | Land | Improvement |
|---|---|---|---|---|
| 2025 | $1,235 | $77,700 | $0 | $0 |
| 2024 | $1,235 | $77,700 | $10,425 | $67,275 |
| 2023 | $1,235 | $77,700 | $10,425 | $67,275 |
| 2022 | $1,069 | $43,275 | $7,425 | $35,850 |
| 2021 | $1,069 | $43,275 | $7,425 | $35,850 |
| 2020 | $1,069 | $43,275 | $7,425 | $35,850 |
| 2019 | $1,069 | $43,275 | $7,425 | $35,850 |
| 2018 | $1,015 | $41,100 | $6,725 | $34,375 |
| 2017 | $1,015 | $41,100 | $6,725 | $34,375 |
| 2016 | $1,015 | $41,100 | $6,725 | $34,375 |
| 2015 | $884 | $41,100 | $6,725 | $34,375 |
| 2014 | $871 | $41,100 | $6,725 | $34,375 |
| 2013 | $871 | $40,500 | $0 | $0 |
Source: Public Records
Map
Nearby Homes
- 2624 Peach Orchard Rd
- 218 Doris Ln
- 813 Sues Way
- 2520 Effler Rd
- 712 Hunter Crest Rd
- 720 Hunter Crest Rd
- 2110 Farris Rd
- 212 Horton Ln
- 105 Chaucer Cir
- 2423 Southview Dr
- 2102 Montvale Rd
- 1245 S Heritage Dr
- 2646 New Blockhouse Rd
- 124 Fowler Dr
- 2912 Dragonfly Way
- 1816 Melton Meadows Dr
- 204 Pistol Creek Trail
- 1812 Melton Meadows Dr
- 1206 Fort Craig Trail
- 1208 Fort Craig Trail
- 2530 Peach Orchard Rd
- 2534 Peach Orchard Rd
- 2522 Peach Orchard Rd
- 2542 Peach Orchard Rd
- 2523 Peach Orchard Rd
- 2526 Peach Orchard Rd
- 2545 Peach Orchard Rd
- 2516 Peach Orchard Rd
- 2505 Peach Orchard Rd
- 2602 Peach Orchard Rd
- 720 Ridge Rd
- 2608 Peach Orchard Rd
- 2504 Peach Orchard Rd
- 728 Ridge Rd
- 628 Ridge Rd
- 711 Ridge Rd
- 2609 Peach Orchard Rd
- 810 Ridge Rd
- 715 Ridge Rd
- 721 Ridge Rd