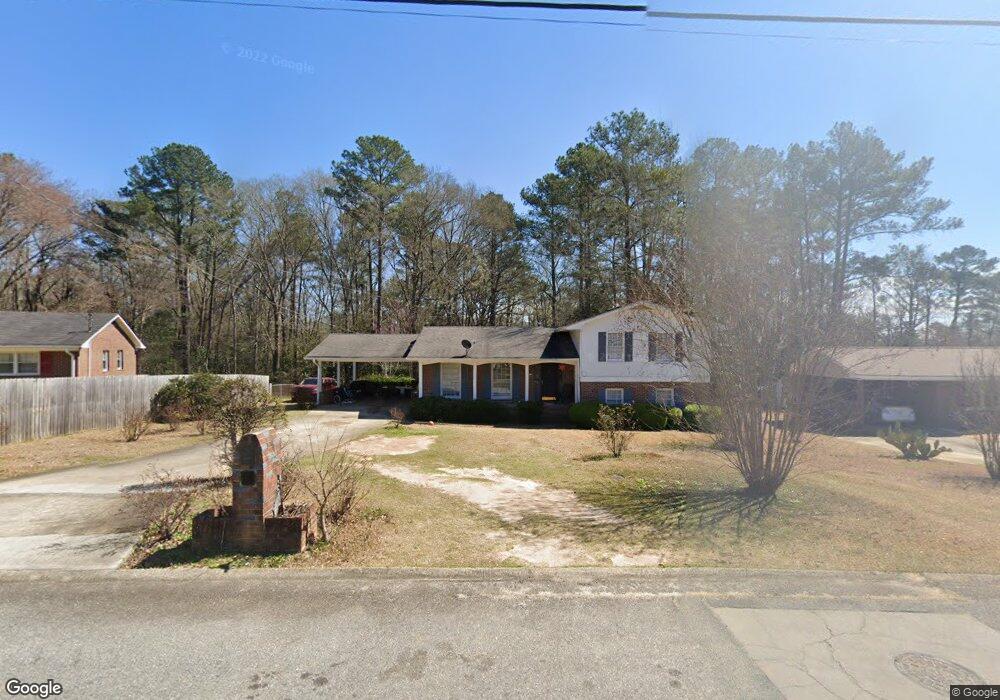
2533 Bedford Place Unit 100-948 Macon, GA 31211
Estimated Value: $96,000 - $136,000
3
Beds
2
Baths
1,258
Sq Ft
$91/Sq Ft
Est. Value
About This Home
This home is located at 2533 Bedford Place Unit 100-948, Macon, GA 31211 and is currently estimated at $114,000, approximately $90 per square foot. 2533 Bedford Place Unit 100-948 is a home located in Bibb County with nearby schools including Martin Luther King Jr. Elementary School, Appling Middle School, and Northeast High School.
Ownership History
Date
Name
Owned For
Owner Type
Purchase Details
Closed on
Jul 15, 2020
Sold by
Broadview Sfga Acquisitions Llc
Bought by
Sfga 2020 Llc
Current Estimated Value
Home Financials for this Owner
Home Financials are based on the most recent Mortgage that was taken out on this home.
Original Mortgage
$1,622,500
Outstanding Balance
$835,374
Interest Rate
3.2%
Mortgage Type
Commercial
Estimated Equity
-$721,374
Purchase Details
Closed on
Feb 13, 2019
Sold by
Us Bank Na
Bought by
Broadview Sega Acquisitions Llc
Home Financials for this Owner
Home Financials are based on the most recent Mortgage that was taken out on this home.
Original Mortgage
$5,000,000
Interest Rate
4.4%
Mortgage Type
Construction
Purchase Details
Closed on
Dec 4, 2018
Sold by
Williams Josephine H
Bought by
Us Bank Na and The Cim Trust
Purchase Details
Closed on
Jun 21, 2005
Sold by
Williams Christopher Channing
Bought by
Williams Josephine H
Create a Home Valuation Report for This Property
The Home Valuation Report is an in-depth analysis detailing your home's value as well as a comparison with similar homes in the area
Home Values in the Area
Average Home Value in this Area
Purchase History
| Date | Buyer | Sale Price | Title Company |
|---|---|---|---|
| Sfga 2020 Llc | -- | Os National Llc | |
| Broadview Sega Acquisitions Llc | $52,500 | None Available | |
| Us Bank Na | $28,994 | None Available | |
| Williams Josephine H | -- | None Avilebel | |
| Williams Josephine H | -- | None Avilabale |
Source: Public Records
Mortgage History
| Date | Status | Borrower | Loan Amount |
|---|---|---|---|
| Open | Sfga 2020 Llc | $1,622,500 | |
| Previous Owner | Broadview Sega Acquisitions Llc | $5,000,000 |
Source: Public Records
Tax History Compared to Growth
Tax History
| Year | Tax Paid | Tax Assessment Tax Assessment Total Assessment is a certain percentage of the fair market value that is determined by local assessors to be the total taxable value of land and additions on the property. | Land | Improvement |
|---|---|---|---|---|
| 2025 | $1,178 | $47,925 | $5,600 | $42,325 |
| 2024 | $1,075 | $42,339 | $3,500 | $38,839 |
| 2023 | $951 | $37,453 | $2,100 | $35,353 |
| 2022 | $1,385 | $39,995 | $3,902 | $36,093 |
| 2021 | $999 | $26,298 | $3,198 | $23,100 |
| 2020 | $815 | $25,193 | $3,198 | $21,995 |
| 2019 | $986 | $25,193 | $3,198 | $21,995 |
| 2018 | $850 | $25,073 | $3,198 | $21,875 |
| 2017 | $408 | $25,073 | $3,198 | $21,875 |
| 2016 | $367 | $25,074 | $3,198 | $21,875 |
| 2015 | $519 | $24,914 | $3,198 | $21,716 |
| 2014 | $686 | $24,914 | $3,198 | $21,716 |
Source: Public Records
Map
Nearby Homes
- 2557 Hyde Park Rd
- 2458 Tredway Dr
- 2371 Kensington Rd
- 2761 Walnut Creek Rd
- 2630 Pauladale Dr
- 2815 New Clinton Rd
- 240 Neptune Ct
- 2029 Kitchens Rd
- 1957 Kitchens Rd
- 161 Woodward Ct
- 131 Sun Valley Dr
- 699 Jasmine Dr
- 699 Jasmine Dr Unit C48
- Birch Plan at Clifton Ridge
- Lane Plan at Clifton Ridge
- Benton Plan at Clifton Ridge
- Duke Plan at Clifton Ridge
- Brooke Plan at Clifton Ridge
- Delilah Plan at Clifton Ridge
- 687 Jasmine Dr
- 2533 Bedford Place
- 2525 Bedford Place
- 2541 Bedford Place
- 2513 Bedford Place
- 2536 Bedford Place
- 2528 Bedford Place
- 2549 Bedford Place
- 2548 Bedford Place
- 2512 Bedford Place
- 2777 Portland Place
- 2557 Bedford Place
- 2504 Bedford Place
- 2562 Bedford Place
- 2548 Hyde Park Rd
- 2527 Mafiel Dr
- 2556 Hyde Park Rd
- 2565 Bedford Place
- 2565 Bedford Place Unit 956
- 2555 Mafiel Dr
- 2407 Mafiel Dr