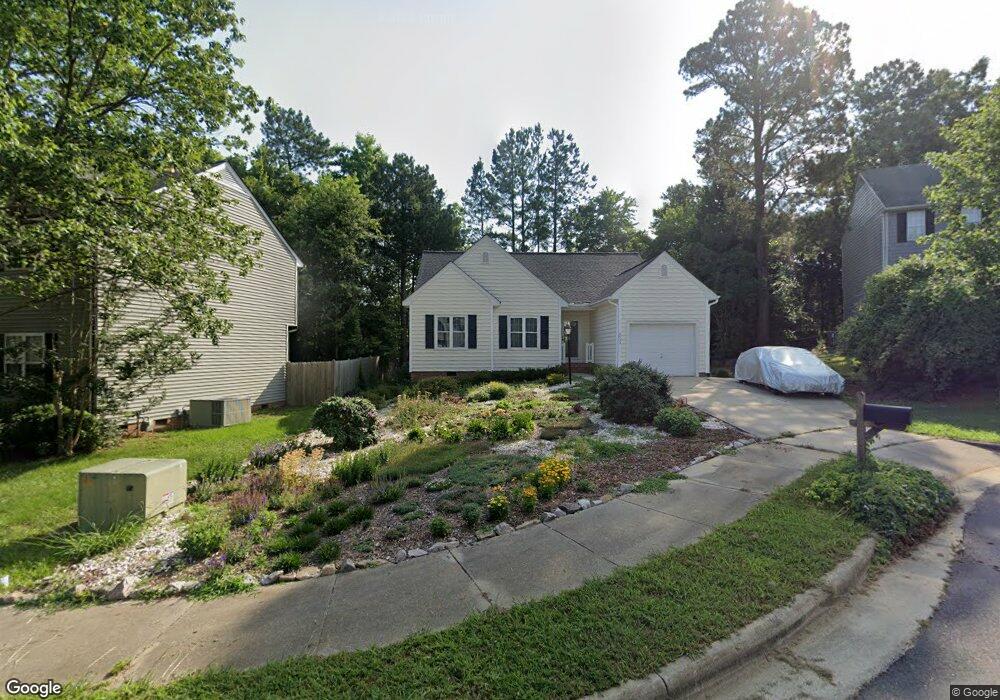
2533 Beech Gap Ct Raleigh, NC 27603
South Raleigh NeighborhoodEstimated Value: $381,000 - $402,000
3
Beds
2
Baths
1,278
Sq Ft
$304/Sq Ft
Est. Value
About This Home
This home is located at 2533 Beech Gap Ct, Raleigh, NC 27603 and is currently estimated at $388,546, approximately $304 per square foot. 2533 Beech Gap Ct is a home located in Wake County with nearby schools including Dillard Drive Magnet Elementary School, Dillard Drive Magnet Middle School, and Longleaf School Of The Arts.
Ownership History
Date
Name
Owned For
Owner Type
Purchase Details
Closed on
Mar 9, 2021
Sold by
Davis Cathy K
Bought by
Davis Michele C
Current Estimated Value
Purchase Details
Closed on
Aug 12, 2010
Sold by
Davis Cathy K
Bought by
Davis Cathy K and Davis Michele C
Home Financials for this Owner
Home Financials are based on the most recent Mortgage that was taken out on this home.
Original Mortgage
$73,000
Interest Rate
4.61%
Mortgage Type
New Conventional
Purchase Details
Closed on
May 27, 1999
Sold by
Perretti Mark V and Perretti Celeste B
Bought by
Davis Cathy K
Home Financials for this Owner
Home Financials are based on the most recent Mortgage that was taken out on this home.
Original Mortgage
$79,000
Interest Rate
6.84%
Purchase Details
Closed on
Oct 21, 1997
Sold by
Perretti Mark V and Perretti Celester B
Bought by
Perretti Mark and Perretti Celeste B
Home Financials for this Owner
Home Financials are based on the most recent Mortgage that was taken out on this home.
Original Mortgage
$114,673
Interest Rate
7.55%
Mortgage Type
FHA
Create a Home Valuation Report for This Property
The Home Valuation Report is an in-depth analysis detailing your home's value as well as a comparison with similar homes in the area
Home Values in the Area
Average Home Value in this Area
Purchase History
| Date | Buyer | Sale Price | Title Company |
|---|---|---|---|
| Davis Michele C | -- | None Available | |
| Davis Michele C | -- | None Listed On Document | |
| Davis Cathy K | -- | None Available | |
| Davis Cathy K | $129,000 | -- | |
| Perretti Mark | -- | -- |
Source: Public Records
Mortgage History
| Date | Status | Borrower | Loan Amount |
|---|---|---|---|
| Previous Owner | Davis Cathy K | $73,000 | |
| Previous Owner | Davis Cathy K | $79,000 | |
| Previous Owner | Perretti Mark | $114,673 |
Source: Public Records
Tax History Compared to Growth
Tax History
| Year | Tax Paid | Tax Assessment Tax Assessment Total Assessment is a certain percentage of the fair market value that is determined by local assessors to be the total taxable value of land and additions on the property. | Land | Improvement |
|---|---|---|---|---|
| 2025 | $3,201 | $364,802 | $160,000 | $204,802 |
| 2024 | $3,188 | $364,802 | $160,000 | $204,802 |
| 2023 | $2,677 | $243,769 | $60,000 | $183,769 |
| 2022 | $2,488 | $243,769 | $60,000 | $183,769 |
| 2021 | $2,392 | $243,769 | $60,000 | $183,769 |
| 2020 | $2,348 | $243,769 | $60,000 | $183,769 |
| 2019 | $2,065 | $176,487 | $54,000 | $122,487 |
| 2018 | $1,851 | $167,627 | $54,000 | $113,627 |
| 2017 | $1,764 | $167,627 | $54,000 | $113,627 |
| 2016 | $1,728 | $167,627 | $54,000 | $113,627 |
| 2015 | $1,707 | $162,963 | $48,000 | $114,963 |
| 2014 | $1,620 | $162,963 | $48,000 | $114,963 |
Source: Public Records
Map
Nearby Homes
- 2528 Beech Gap Ct
- 2901 Alder Ridge Ln
- 2816 Alder Ridge Ln
- 2221 Mountain Mist Ct Unit 201
- 2201 Mountain Mist Ct Unit 103
- 2108 Leadenhall Way
- 2505 Ferndown Ct
- 2524 Ferndown Ct
- 1901 Trailwood Heights Ln Unit 304
- 2271 Trailwood Valley Cir
- 2659 Broad Oaks Place
- 2831 Barrymore St Unit 107
- 2607 Sterling Park Dr
- 2621 Ivory Run Way Unit 105
- 2639 Broad Oaks Place Unit 21
- 2920 Barrymore St Unit 106
- 2228 Trailwood Valley Cir
- 2636 Scattered Oak Ct
- 3008 Isabella Dr
- 3115 Tryon Rd
- 2525 Beech Gap Ct
- 2537 Beech Gap Ct
- 2412 Appalachian Dr
- 2404 Appalachian Dr
- 2517 Beech Gap Ct
- 2416 Appalachian Dr
- 2420 Appalachian Dr
- 2400 Appalachian Dr
- 2541 Beech Gap Ct
- 2532 Beech Gap Ct
- 2424 Appalachian Dr
- 2536 Beech Gap Ct
- 520 Appalachian Dr Unit Lot54
- 512 Appalachian Dr Unit Lot52
- 504 Appalachian Dr Unit Lot50
- 412 Appalachian Dr Unit Lot43
- 404 Appalachian Dr
- 500 Appalachian Dr Unit Lot49
- 428 Appalachian Dr
- 432 Appalachian Dr