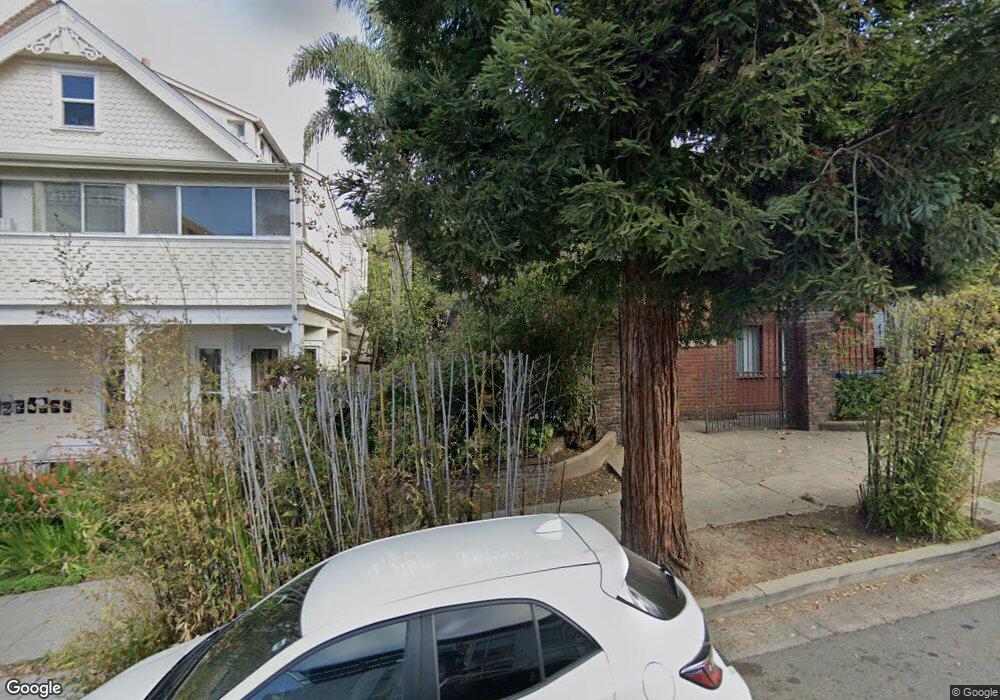
2533 Ridge Rd Unit B Berkeley, CA 94709
North Berkeley NeighborhoodEstimated Value: $647,000 - $791,000
1
Bed
1
Bath
962
Sq Ft
$722/Sq Ft
Est. Value
About This Home
This home is located at 2533 Ridge Rd Unit B, Berkeley, CA 94709 and is currently estimated at $694,961, approximately $722 per square foot. 2533 Ridge Rd Unit B is a home located in Alameda County with nearby schools including Berkeley Arts Magnet at Whittier School, Washington Elementary School, and Cragmont Elementary School.
Ownership History
Date
Name
Owned For
Owner Type
Purchase Details
Closed on
May 6, 1996
Sold by
Rammer Paul
Bought by
Phh Real Estate Services Corp
Current Estimated Value
Home Financials for this Owner
Home Financials are based on the most recent Mortgage that was taken out on this home.
Original Mortgage
$100,000
Interest Rate
8.09%
Mortgage Type
Purchase Money Mortgage
Purchase Details
Closed on
Mar 19, 1996
Sold by
Rammer Paul and Mcdowell Charles E
Bought by
Shaykevich Yakov and Shaykevich Svetlana
Home Financials for this Owner
Home Financials are based on the most recent Mortgage that was taken out on this home.
Original Mortgage
$100,000
Interest Rate
8.09%
Mortgage Type
Purchase Money Mortgage
Purchase Details
Closed on
Dec 29, 1994
Sold by
Mcdowell Charles E
Bought by
Mcdowell Charles E
Create a Home Valuation Report for This Property
The Home Valuation Report is an in-depth analysis detailing your home's value as well as a comparison with similar homes in the area
Home Values in the Area
Average Home Value in this Area
Purchase History
| Date | Buyer | Sale Price | Title Company |
|---|---|---|---|
| Phh Real Estate Services Corp | -- | Placer Title Company | |
| Shaykevich Yakov | -- | Placer Title Company | |
| Mcdowell Charles Ervin | -- | Placer Title Company | |
| Rammer Paul | -- | Placer Title Company | |
| Mcdowell Charles E | -- | -- |
Source: Public Records
Mortgage History
| Date | Status | Borrower | Loan Amount |
|---|---|---|---|
| Previous Owner | Mcdowell Charles Ervin | $100,000 | |
| Previous Owner | Shaykevich Yakov | $68,000 |
Source: Public Records
Tax History
| Year | Tax Paid | Tax Assessment Tax Assessment Total Assessment is a certain percentage of the fair market value that is determined by local assessors to be the total taxable value of land and additions on the property. | Land | Improvement |
|---|---|---|---|---|
| 2025 | $4,426 | $205,833 | $36,073 | $176,760 |
| 2024 | $4,426 | $201,661 | $35,366 | $173,295 |
| 2023 | $4,318 | $204,570 | $34,673 | $169,897 |
| 2022 | $4,210 | $193,559 | $33,993 | $166,566 |
| 2021 | $4,197 | $189,627 | $33,326 | $163,301 |
| 2020 | $3,912 | $194,612 | $32,985 | $161,627 |
| 2019 | $3,690 | $190,796 | $32,338 | $158,458 |
| 2018 | $3,610 | $187,056 | $31,704 | $155,352 |
| 2017 | $3,460 | $183,390 | $31,083 | $152,307 |
| 2016 | $3,296 | $179,794 | $30,473 | $149,321 |
| 2015 | $3,244 | $177,095 | $30,016 | $147,079 |
| 2014 | $3,203 | $173,626 | $29,428 | $144,198 |
Source: Public Records
Map
Nearby Homes
- 2634 Virginia St Unit 13
- 2700 Le Conte Ave Unit 301
- 2700 Le Conte Ave Unit 402
- 1698 La Loma Ave Unit 1698
- 2451 Le Conte Ave
- 2600 Hilgard Ave
- 2477 Virginia St
- 2365 Virginia St Unit 2
- 2340 Virginia St
- 1622 Scenic Ave
- 1739 Spruce St
- 2201 Virginia St Unit 2
- 1471 Scenic Ave
- 1682 Oxford St
- 2893 Buena Vista Way
- 1519 Oxford St Unit E
- 2501 Rose Walk
- 1444 Walnut St
- 1412 Oxford St
- 2015 Delaware St
- 2533 Ridge Rd Unit A
- 2535 Ridge Rd Unit C
- 2535 Ridge Rd Unit D
- 2535 Ridge Rd Unit B
- 2535 Ridge Rd Unit A
- 1780 Le Roy Ave Unit 1
- 1780 Le Roy Ave Unit 12-full 3 room
- 1780 Le Roy Ave Unit 2
- 1780 Le Roy Ave Unit 12
- 1780 Le Roy Ave Unit 21
- 1780 Le Roy Ave Unit 33
- 1780 Le Roy Ave
- 2531 Ridge Rd Unit 2531 Ridge Unit 6
- 2531 Ridge Rd Unit 4
- 2531 Ridge Rd Unit 6
- 2531 Ridge Rd Unit 2531 Ridge Unit 5
- 2531 Ridge Rd Unit 2
- 1776 Le Roy Ave
- 1772 Le Roy Ave
- 2523 Ridge Rd Unit 210
Your Personal Tour Guide
Ask me questions while you tour the home.