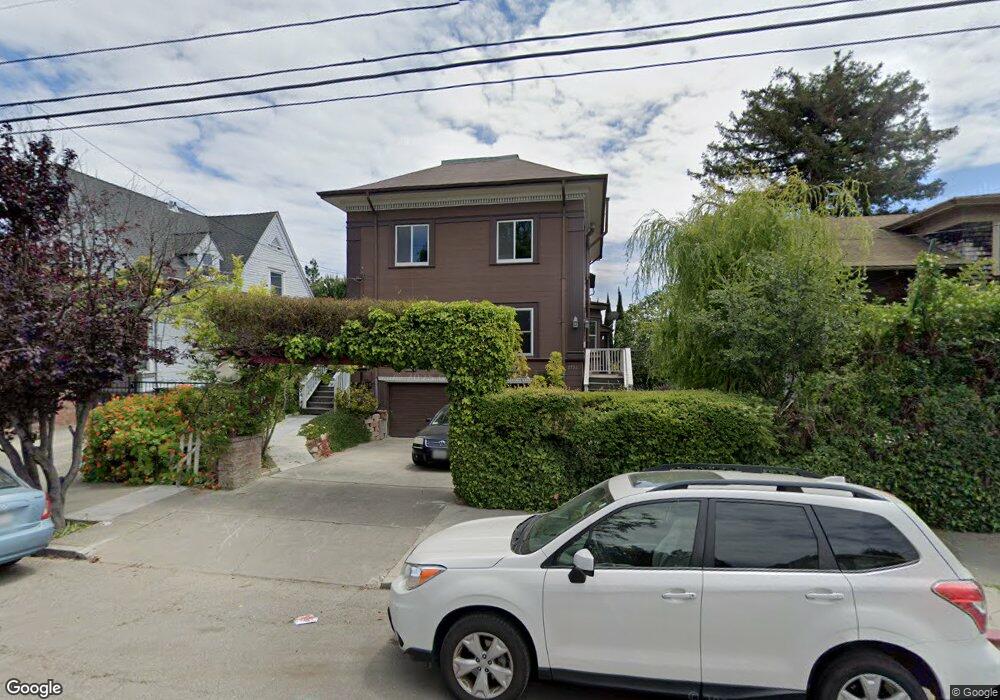
2534 10th Ave Oakland, CA 94606
Bella Vista NeighborhoodEstimated Value: $762,000 - $1,472,000
4
Beds
3
Baths
2,220
Sq Ft
$520/Sq Ft
Est. Value
About This Home
This home is located at 2534 10th Ave, Oakland, CA 94606 and is currently estimated at $1,155,278, approximately $520 per square foot. 2534 10th Ave is a home located in Alameda County with nearby schools including Bella Vista Elementary School, Edna Brewer Middle School, and Oakland High School.
Ownership History
Date
Name
Owned For
Owner Type
Purchase Details
Closed on
Jun 14, 2021
Sold by
Baranowski Dominik and Barokov Julia
Bought by
Manning William T and Bijur Kristin A
Current Estimated Value
Home Financials for this Owner
Home Financials are based on the most recent Mortgage that was taken out on this home.
Original Mortgage
$600,000
Outstanding Balance
$543,225
Interest Rate
2.9%
Mortgage Type
New Conventional
Estimated Equity
$612,053
Purchase Details
Closed on
Apr 4, 2017
Sold by
Julia Baranowski Dominik and Julia Barokov
Bought by
Julia Baranowski Dominik and Julia Barokov
Purchase Details
Closed on
Jun 22, 2016
Sold by
Lavan Natalie
Bought by
Julia Baranowski Dominik and Julia Barokov
Home Financials for this Owner
Home Financials are based on the most recent Mortgage that was taken out on this home.
Original Mortgage
$506,000
Interest Rate
3.58%
Mortgage Type
New Conventional
Purchase Details
Closed on
Jan 18, 2013
Sold by
Julia Baranowski Dominik and Julia Barokov
Bought by
Julia Baranowski Dominik and Julia Barokov
Home Financials for this Owner
Home Financials are based on the most recent Mortgage that was taken out on this home.
Original Mortgage
$530,515
Interest Rate
3.5%
Mortgage Type
FHA
Purchase Details
Closed on
Apr 23, 2010
Sold by
Mantra Group Llc
Bought by
Baranowski Dominik and Smolikov Julia
Home Financials for this Owner
Home Financials are based on the most recent Mortgage that was taken out on this home.
Original Mortgage
$542,327
Interest Rate
5.25%
Mortgage Type
FHA
Purchase Details
Closed on
Feb 4, 2010
Sold by
Ratener Michael C and Goodell Mary M
Bought by
Mantra Group Narciso Investments & Equit
Home Financials for this Owner
Home Financials are based on the most recent Mortgage that was taken out on this home.
Original Mortgage
$171,200
Interest Rate
5%
Mortgage Type
Purchase Money Mortgage
Purchase Details
Closed on
Jul 21, 2006
Sold by
Ratener Michael C and Goodell Mary M
Bought by
Ratener Michael C and Goodell Mary M
Home Financials for this Owner
Home Financials are based on the most recent Mortgage that was taken out on this home.
Original Mortgage
$650,000
Interest Rate
6.63%
Mortgage Type
Purchase Money Mortgage
Purchase Details
Closed on
Jun 27, 2006
Sold by
Drake Alicia A
Bought by
Ratener Michael C and Goodell Mary M
Home Financials for this Owner
Home Financials are based on the most recent Mortgage that was taken out on this home.
Original Mortgage
$650,000
Interest Rate
6.63%
Mortgage Type
Purchase Money Mortgage
Purchase Details
Closed on
Jul 12, 2005
Sold by
Drake Alicia A and Rabinovici Alicia
Bought by
Drake Alicia A
Home Financials for this Owner
Home Financials are based on the most recent Mortgage that was taken out on this home.
Original Mortgage
$520,000
Interest Rate
1%
Mortgage Type
New Conventional
Purchase Details
Closed on
Nov 9, 2001
Sold by
Rabinovici Vadim
Bought by
Rabinovici Alicia
Home Financials for this Owner
Home Financials are based on the most recent Mortgage that was taken out on this home.
Original Mortgage
$235,000
Interest Rate
6.63%
Purchase Details
Closed on
Jan 15, 1999
Sold by
Jung Conrad L and Jung Douglas L
Bought by
Rabinovici Vadim and Rabinovici Alicia
Home Financials for this Owner
Home Financials are based on the most recent Mortgage that was taken out on this home.
Original Mortgage
$192,850
Interest Rate
6.63%
Mortgage Type
Purchase Money Mortgage
Create a Home Valuation Report for This Property
The Home Valuation Report is an in-depth analysis detailing your home's value as well as a comparison with similar homes in the area
Home Values in the Area
Average Home Value in this Area
Purchase History
| Date | Buyer | Sale Price | Title Company |
|---|---|---|---|
| Manning William T | $1,270,000 | Chicago Title Company | |
| Julia Baranowski Dominik | -- | None Available | |
| Julia Baranowski Dominik | $100,000 | Old Republic Title Company | |
| Julia Baranowski Dominik | -- | Old Republic Title Company | |
| Lavan Natalie | -- | Old Republic Title Company | |
| Baranowski Dominik | $600,000 | Old Republic Title Company | |
| Mantra Group Narciso Investments & Equit | $234,900 | None Available | |
| Ratener Michael C | -- | Old Republic Title Company | |
| Ratener Michael C | $830,000 | Old Republic Title Company | |
| Drake Alicia A | -- | Fidelity National Title Co | |
| Rabinovici Alicia | -- | Fidelity National Title Co | |
| Rabinovici Vadim | $203,000 | Nortwestern Title Company | |
| Jung Douglas L | -- | Nortwestern Title Company |
Source: Public Records
Mortgage History
| Date | Status | Borrower | Loan Amount |
|---|---|---|---|
| Open | Manning William T | $600,000 | |
| Previous Owner | Julia Baranowski Dominik | $506,000 | |
| Previous Owner | Julia Baranowski Dominik | $530,515 | |
| Previous Owner | Baranowski Dominik | $542,327 | |
| Previous Owner | Mantra Group Narciso Investments & Equit | $171,200 | |
| Previous Owner | Ratener Michael C | $650,000 | |
| Previous Owner | Drake Alicia A | $520,000 | |
| Previous Owner | Rabinovici Alicia | $235,000 | |
| Previous Owner | Jung Douglas L | $192,850 |
Source: Public Records
Tax History
| Year | Tax Paid | Tax Assessment Tax Assessment Total Assessment is a certain percentage of the fair market value that is determined by local assessors to be the total taxable value of land and additions on the property. | Land | Improvement |
|---|---|---|---|---|
| 2025 | $19,423 | $1,374,673 | $412,402 | $962,271 |
| 2024 | $19,423 | $1,347,723 | $404,317 | $943,406 |
| 2023 | $20,493 | $1,321,307 | $396,392 | $924,915 |
| 2022 | $19,976 | $1,295,400 | $388,620 | $906,780 |
| 2021 | $13,185 | $829,200 | $250,860 | $585,340 |
| 2020 | $13,038 | $827,630 | $248,289 | $579,341 |
| 2019 | $12,549 | $811,404 | $243,421 | $567,983 |
| 2018 | $12,283 | $795,500 | $238,650 | $556,850 |
| 2017 | $11,809 | $779,903 | $233,971 | $545,932 |
| 2016 | $10,072 | $654,227 | $196,268 | $457,959 |
| 2015 | $10,019 | $644,405 | $193,321 | $451,084 |
| 2014 | $10,215 | $631,787 | $189,536 | $442,251 |
Source: Public Records
Map
Nearby Homes
Your Personal Tour Guide
Ask me questions while you tour the home.